Your Share of Voice dashboards just got a major upgrade — dark boosts are now included, new sentiment & brand filters give you deeper control over your competitive view, and we are launching TikTok support.
Dark Boosts
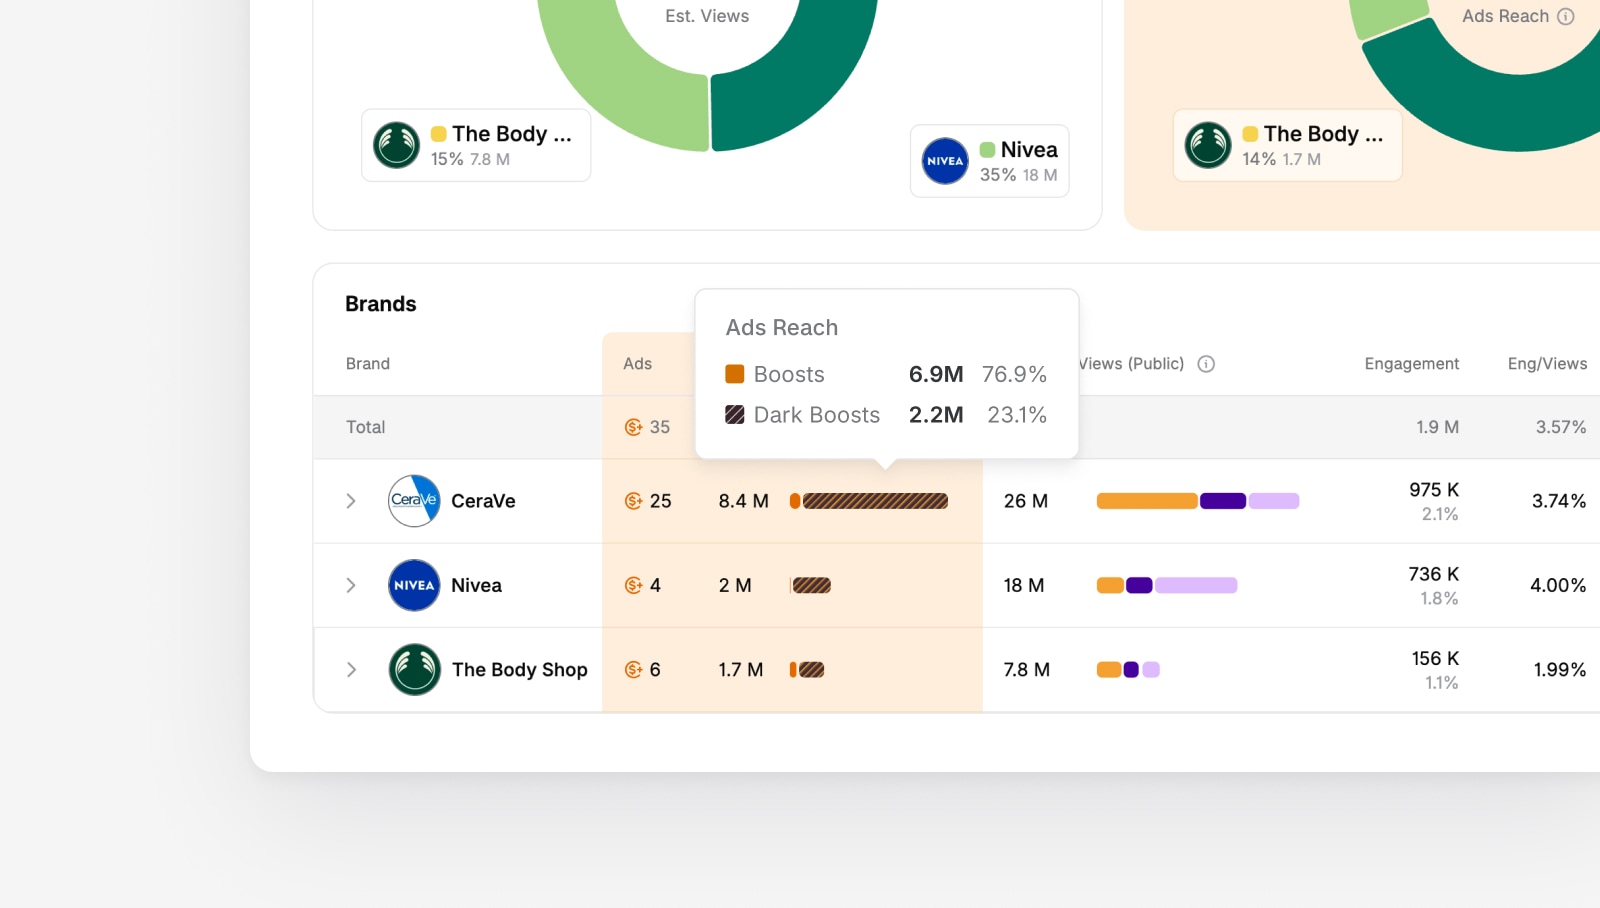
The Share of Voice dashboard now includes dark boosts. A dark boost is when a brand boosts an influencer's content, but the content is hidden from the influencer’s profile, making the collaboration invisible.
Hide Brand Profiles
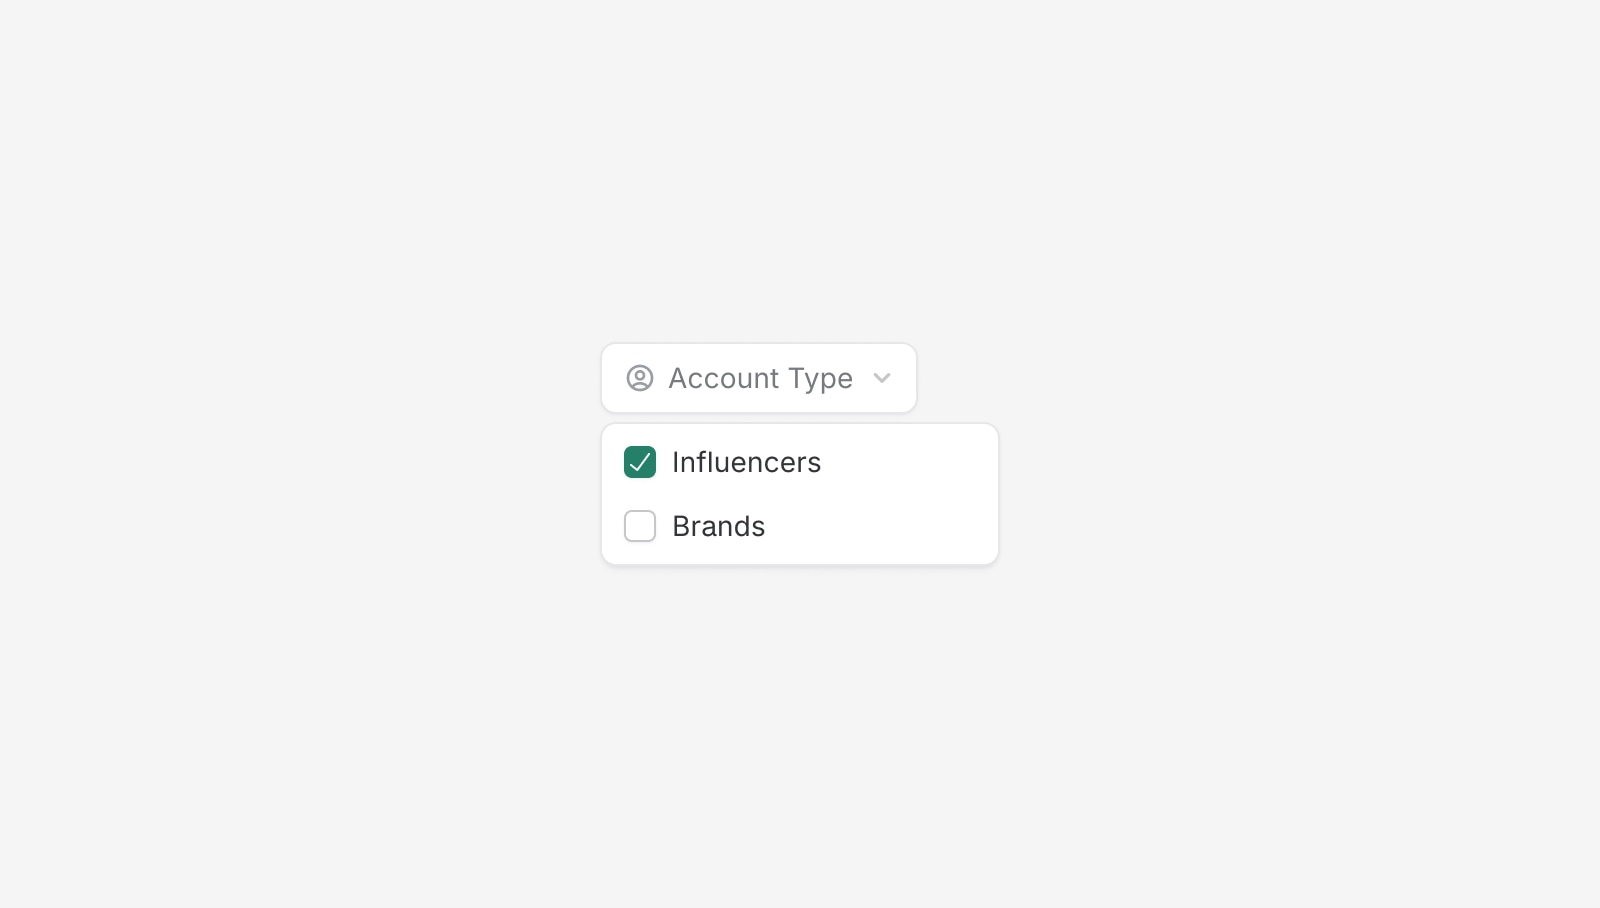
- A new Brand filter automatically removes brand-owned profiles from your dashboards by default
- This keeps your data focused on actual influencer partnerships, not brand self-promotion
Filter by Sentiment
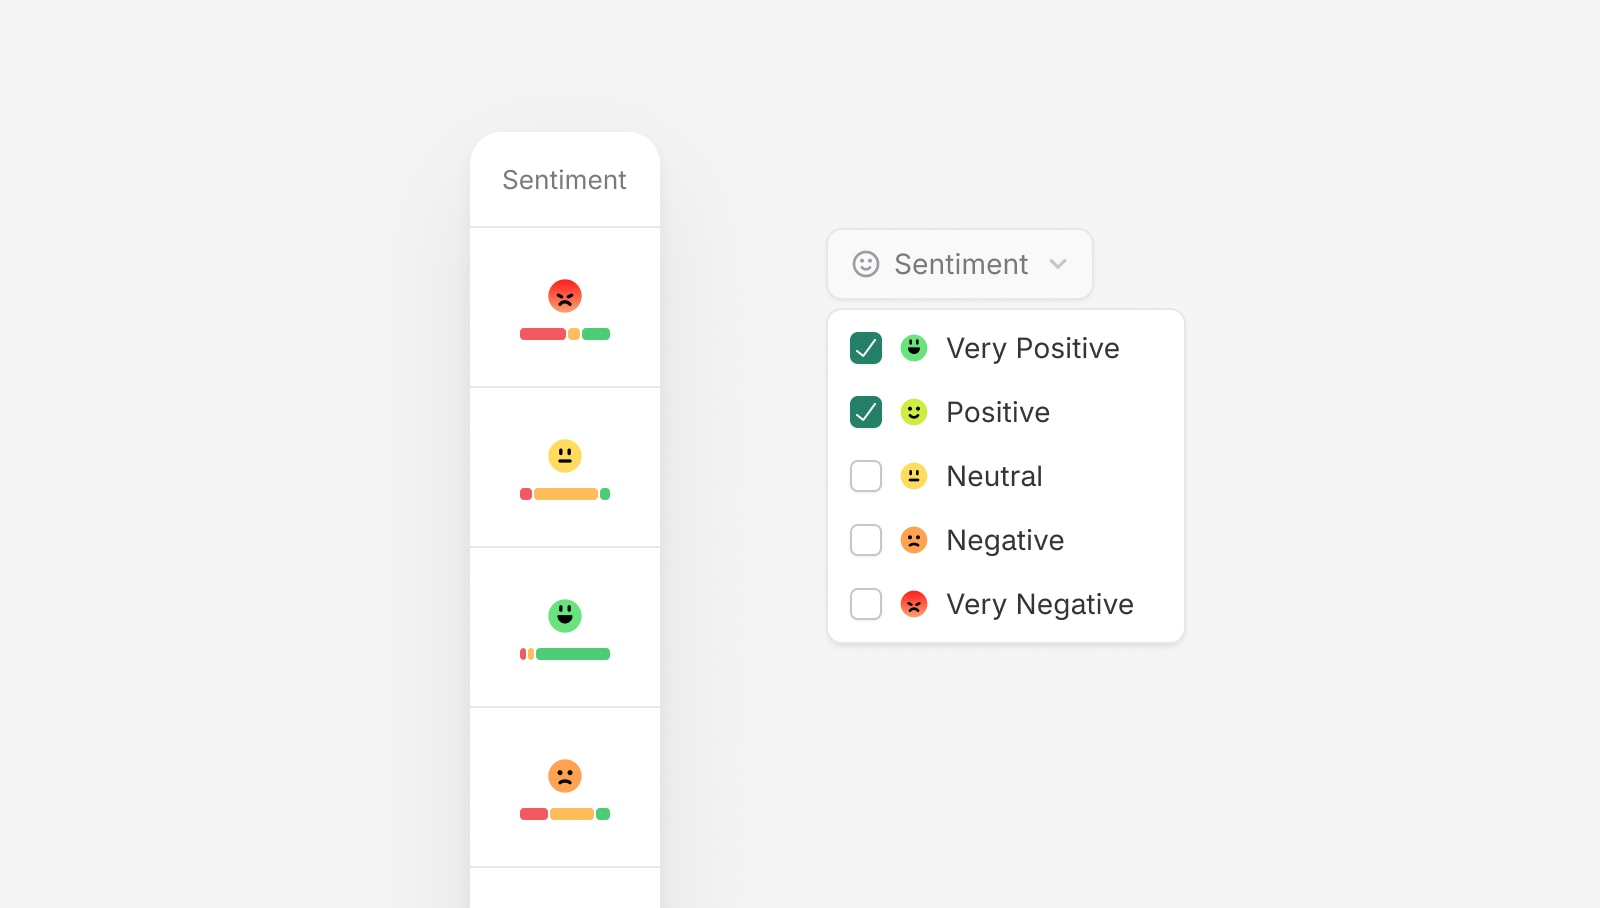
- Filter your data by sentiment expressed by the influencer. We analyze sentiment for every brand and every product on all content.
- Sentiment is now visible on the Share of Voice dashboard when you expand the influencer list under a brand
More Improvements
- Carousel detail: Navigate through all items in a carousel post from the content detail view
- Hidden likes: When an influencer might have hidden their likes, we hint at this where relevant
- Clickable timestamps: Click on any timestamp in the content detail to jump to that exact moment in the video
Updated Dashboard Metrics
We updated how we handle organic and boosted metrics within your selected date range. The numbers on your dashboards might have changed; Here’s what’s new.
Key Principle
Metrics on dashboards always reflect only the selected date range. We never show lifetime numbers in the main dashboards. Every view and engagement you see was recorded within the period you selected — giving you an accurate picture of what happened in that specific timeframe.
Date Range Selection
All metrics displayed on the dashboard are scoped to your selected date range. We only show metric values (views, engagement) that were accumulated during that period — not lifetime totals. For example, if a post has 1 million views overall but gained 50,000 of them during your selected date range, we show 50,000.
What Content Is Included
Content appears in your dashboard when it meets any of these three criteria:
- Published within the selected date range
All content released during your chosen period is included. - Published up to 30 days before the selected date range — with metric activity during the selected date range
We look back 30 days before your start date. If content from that window gained any new views or engagement during your selected period, it is included. Older content with zero activity in your date range is not shown. - Had a paid ad running during the selected date range
If an ad campaign was active for a piece of content at any point during your selected period, that content is included regardless of when it was originally published. This ensures full visibility into ad-supported performance.
Lifetime Metrics
Full lifetime views and engagement for a piece of content are always available in the content sidebar. This gives you the complete picture alongside the date-range-scoped metrics shown in the main dashboard.
TikTok Is Here

Ravineo Influencer Analytics now supports TikTok (in beta) alongside Instagram. Get the same powerful AI-driven brand detection, sentiment analysis, and competitive insights — now across both platforms.
Switch between Instagram and TikTok using the platform tabs on your dashboard. Contact us to activate TikTok for your dashboards — get in touch here.