Scrutinize every ad of your competition, including reach and estimated spend.
The Ad Campaigns view is one of the only 2 views in Ravineo Ads Research, alongside the Dashboard view. And it’s very powerful.
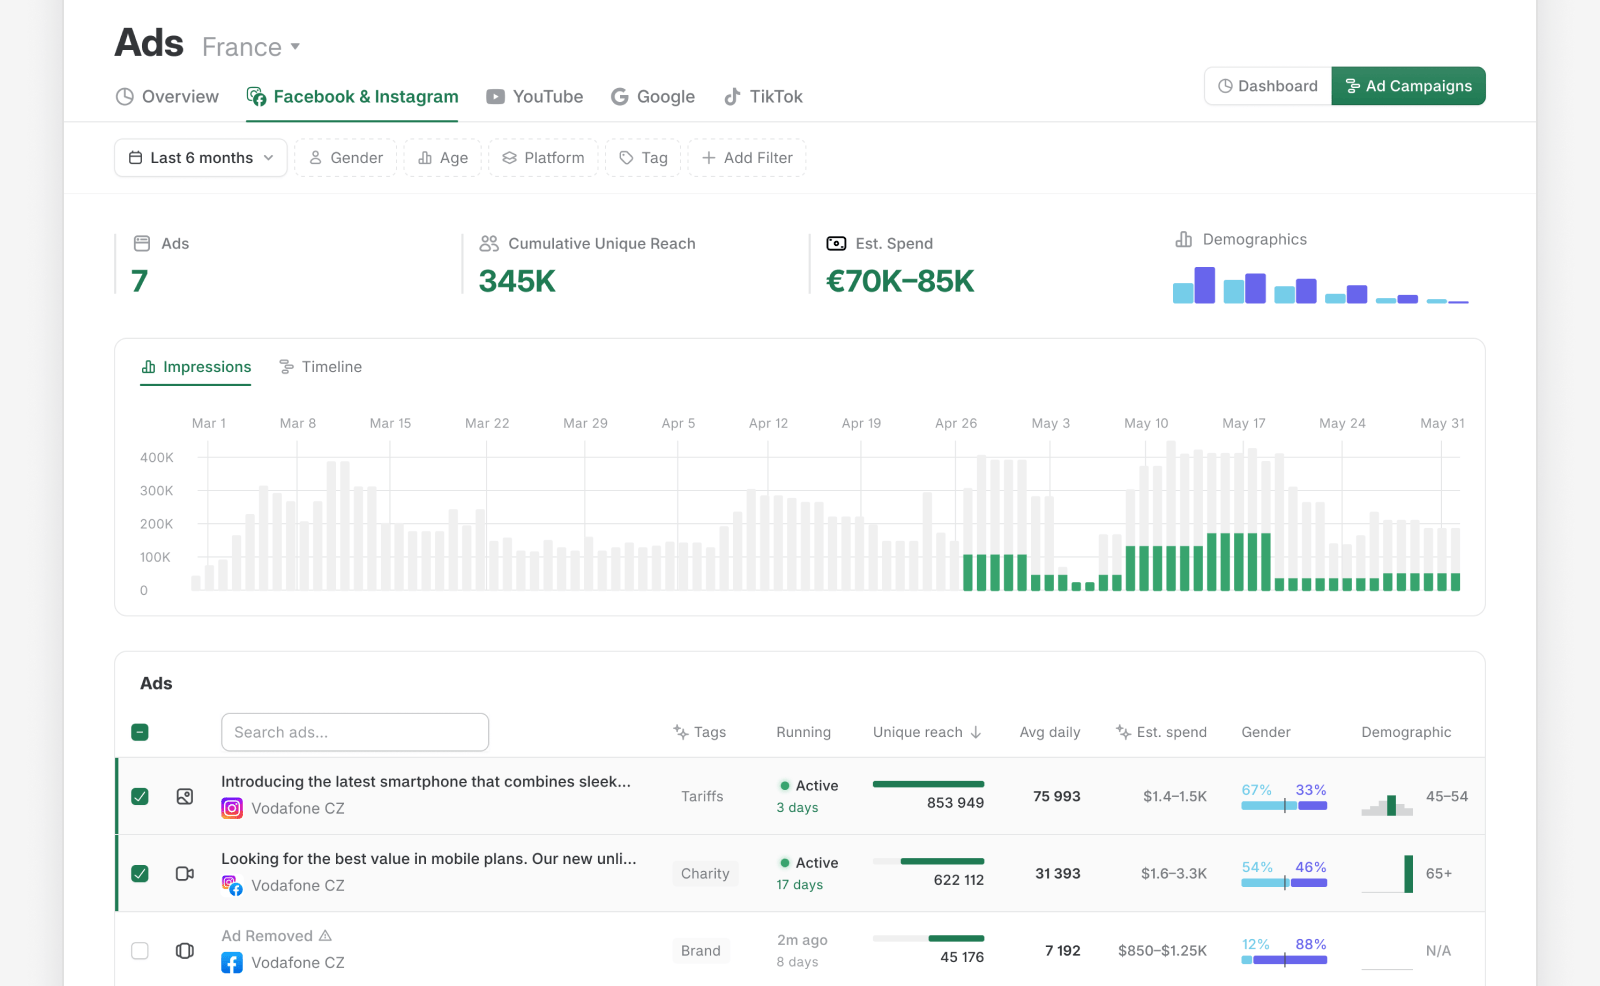
Here, you can see every single ad run by anyone on your dashboard. Some of the indicators we show include (based on platform):
- Ad content
- Running time and since when
- Unique reach
- Average daily reach
- Category (AI-detected!)
- Estimated spend
- Gender
- Demographics
Read more about our metric and indicators here.
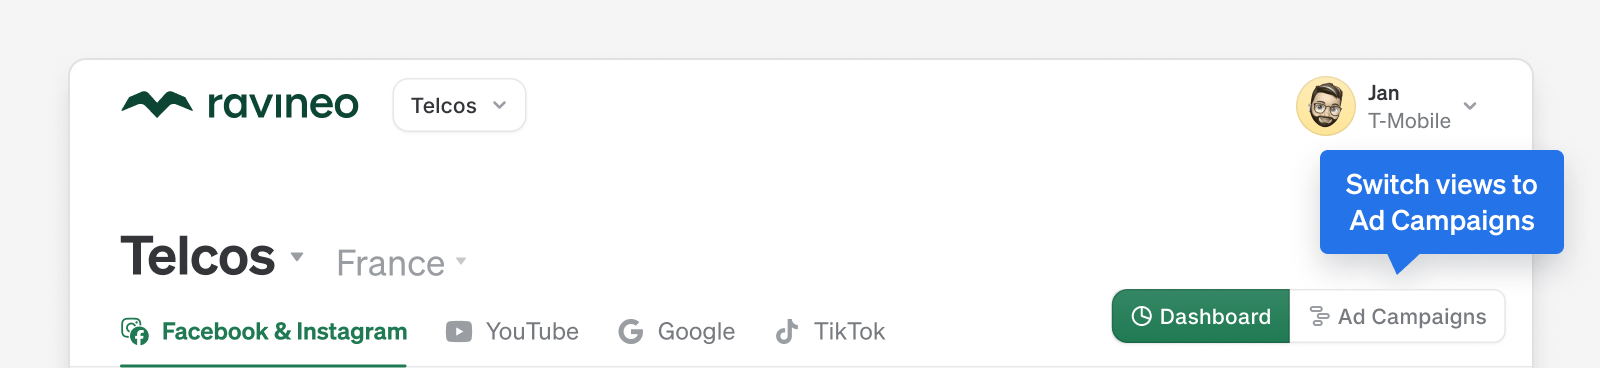
Switching to ad campaigns
You can switch to Ad Campaigns view at the top right of the dashboard. If you have any filters on, switching between Dashboard and Ad Campaigns will respect that and keep the filters.
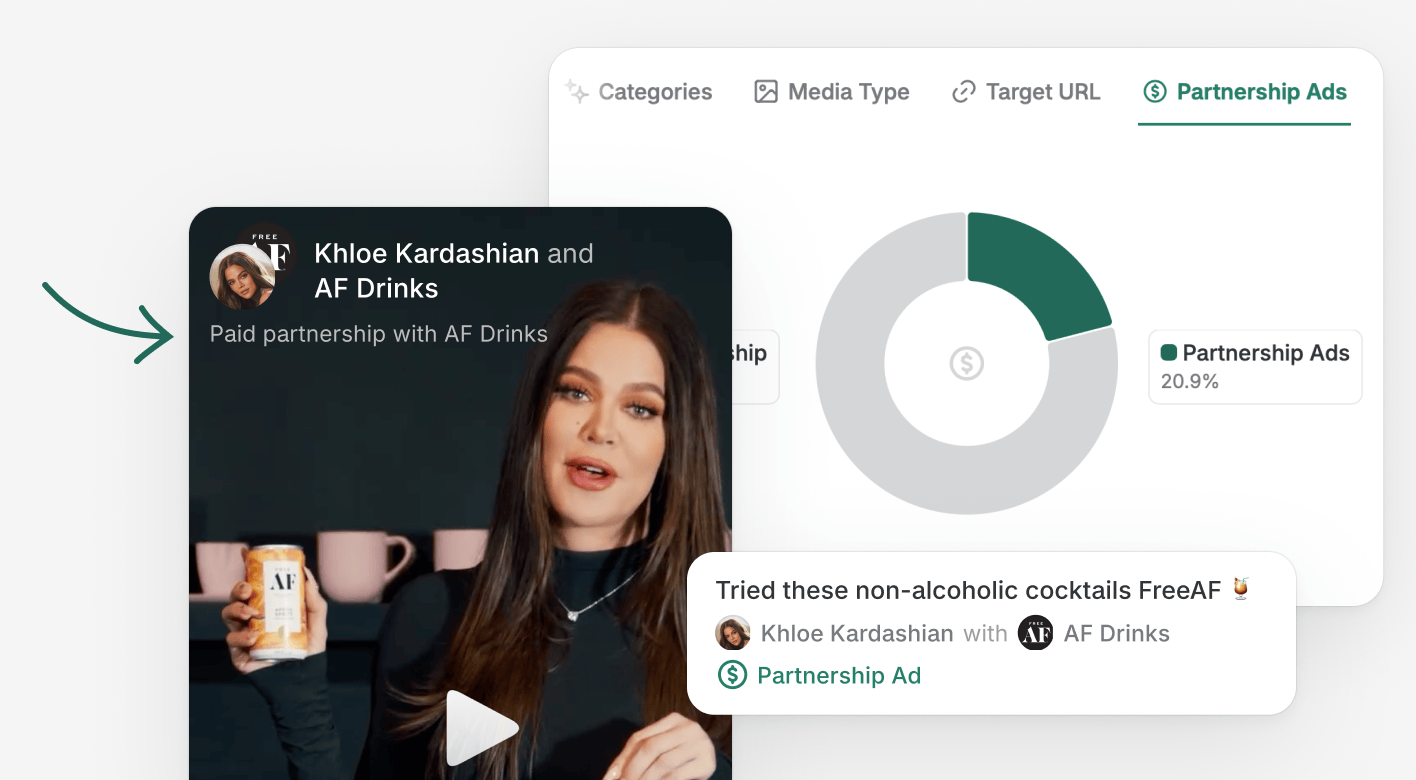
Partnership Ads
Track and analyze your collaborations with our partnership chart, showing the percentage of Partnership Ads —ads created in collaboration with creators, brands, or other businesses, such as boosted influencer campaigns.
Partnership insights are seamlessly integrated across the platform: filter by partnership, view it in the ads table, and explore it in the detailed ad view within the new sidebar.
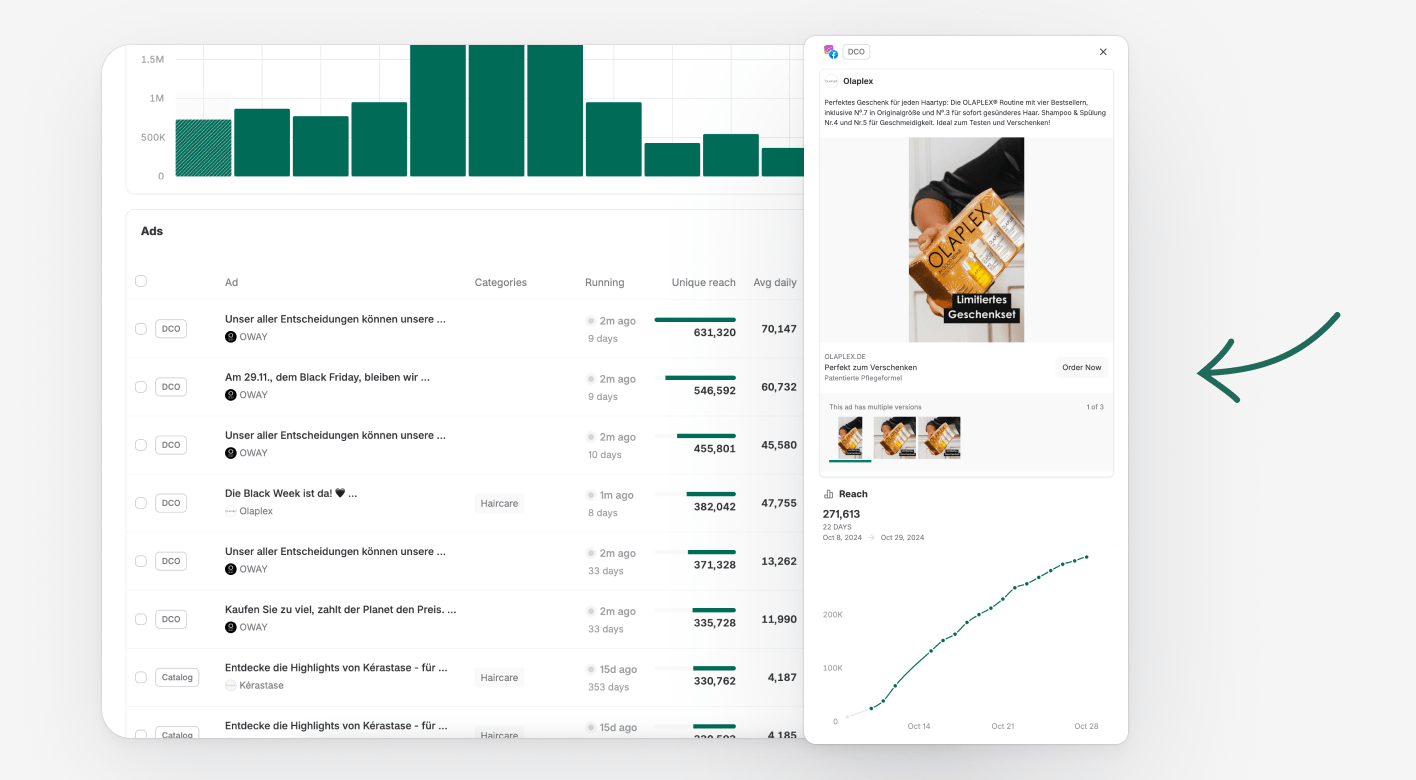
Ads Detail
Click on an ad to open a sidebar with detailed info,including:
- Full content, including images and videos
- Reach chart over time
- Targeting
- Links
- UTM parameters
- AI-generated categories
Currently available for Facebook and Instagram, with more platforms coming soon.
Selecting ads
If you click the checkbox on the left side of each ad, we will select it and highlight its impact on reach (or impressions) in the top chart. Combine this with filters and AI categorisation, and you have an extremely powerful way to view granular competitive campaigns data.
Ravineo & Meta Metrics Comparison
Metric | Ravineo | Meta (Facebook & Instagram) |
|---|---|---|
Reach Calculation | Cumulative Unique Reach: Sum of the unique reach for each individual ad. Captures the total exposure across multiple ads. | Deduplicated Unique Reach: Tracks the actual number of distinct individuals reached across multiple ads, eliminating duplicates. |
Example (10 Ads) | If 10 ads each reach 1M people, Ravineo reports a total reach of 10M. | Meta would show a deduplicated reach of, for example, 1.4M unique people across the 10 ads. |
Deduplication | No Deduplication: Summing up the unique reach of each ad provides a standardized comparison of total exposure. | Deduplication Applied: Meta deduplicates users across ads within their platform, removing repeat counts of the same individual. |
Share of Ads Voice | Represents the total attention captured by summing the reach of all ads. Gives a comprehensive view of campaign reach. | Focus on Unique Reach: Meta’s deduplication aims for exact precision within the Meta ecosystem, reporting the total unique exposure. |
Comparison Strength | Cross-platform, comprehensive: Share of Ads Voice works across multiple platforms, giving a full-market view. | Platform-limited: Meta’s reach data is specific to its ecosystem, limiting comparisons outside of Facebook/Instagram. |
Data Limitation | Cross-Ad Comparison Possible: Ravineo does not deduplicate across multiple ads due to privacy and technical constraints. | Single-Ad Focus: Meta focuses on deduplicating reach within individual campaigns but doesn’t offer comprehensive cross-platform views. |
Read Next: