Our estimate of your competitors' spend using our statistical models — and how to calibrate it for your market.
Ravineo's Estimated Spend provides a reliable approximation of how much your competitors are investing in their ad campaigns. We currently calculate this data for Meta (Facebook & Instagram), YouTube, Google, and TikTok.
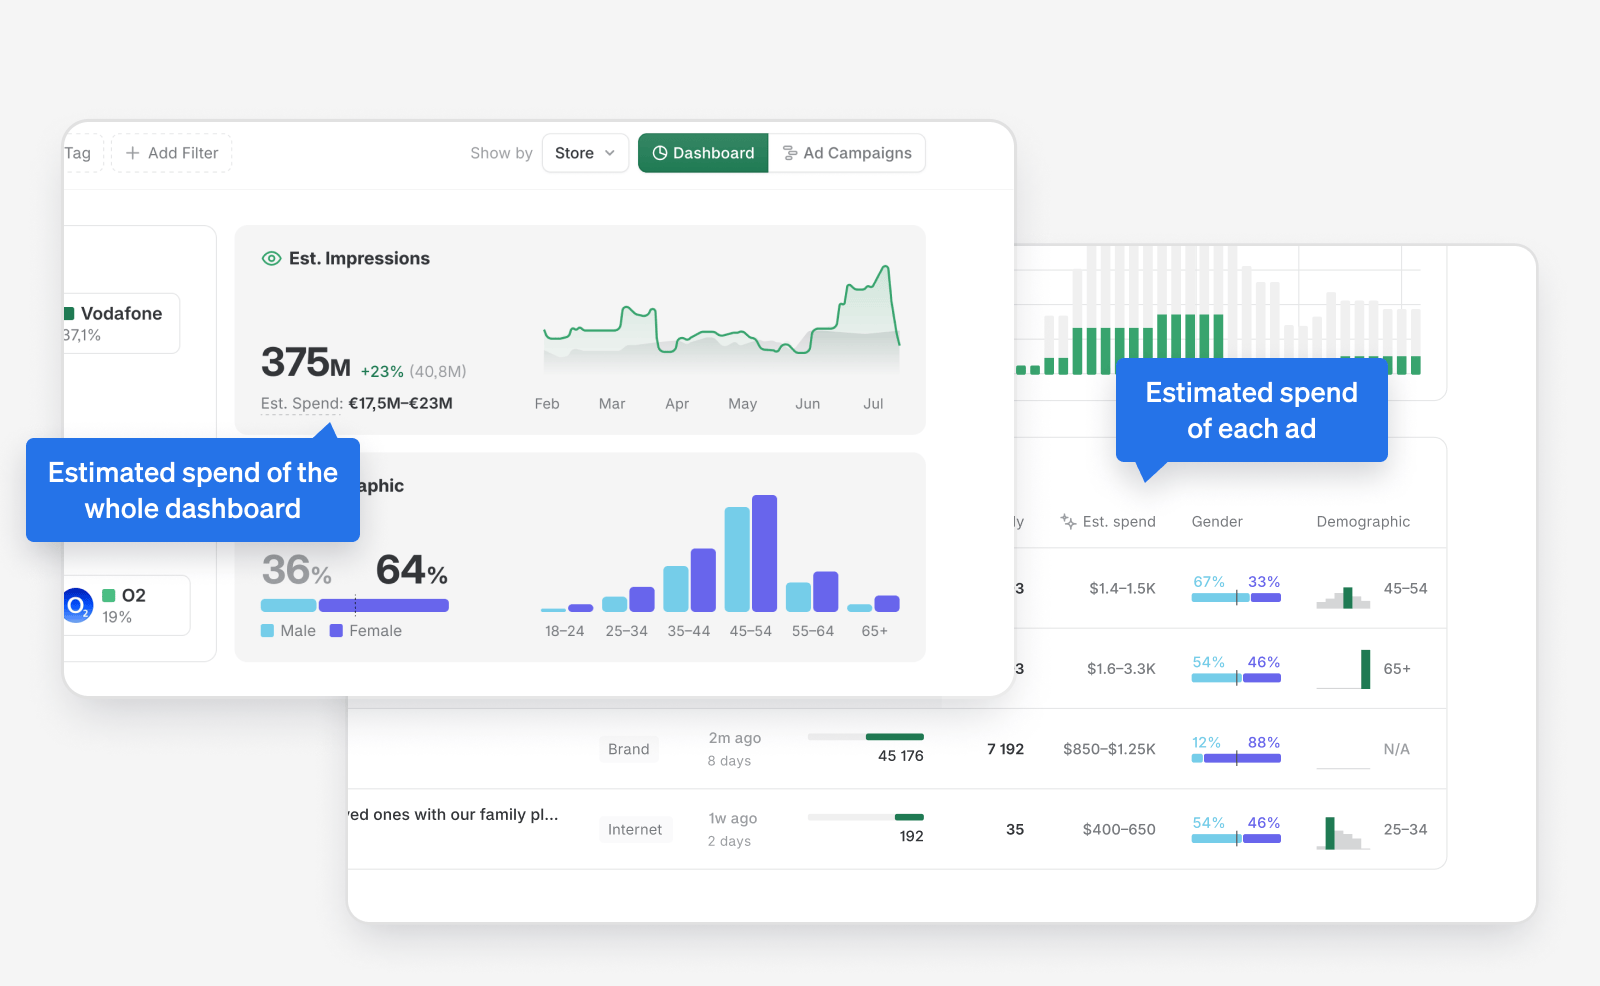
The most prominent place where we use spend estimates is on the Spend Overview dashboard. You can see estimated spend throughout Ravineo:
- Overall spend, estimated for the whole dashboard
- Estimated spend for each brand
- Estimated spend for every individual ad
How it works
We compare each ad's reach (or impressions), country, and demographics to similar ads with publicly available spend data. We then calculate the estimated spend through a custom-trained AI model built on this public data.
The model applies benchmark average prices across all countries and platforms. In most market segments the estimates work well out of the box. However, media pricing, platform dynamics, and buying conditions can vary significantly by market, category, and over time.
What this means in practice: If the spend you see on your own brand doesn't match your internal numbers, it is typically because each sector and advertiser behaves slightly differently, and our models apply market-wide averages. The good news: advertisers in the same space tend to have similar behaviour, so competitors' spend is most likely off by a similar margin to yours — making the data still highly comparable for share-of-voice and competitive benchmarking.
Configure Spend Model
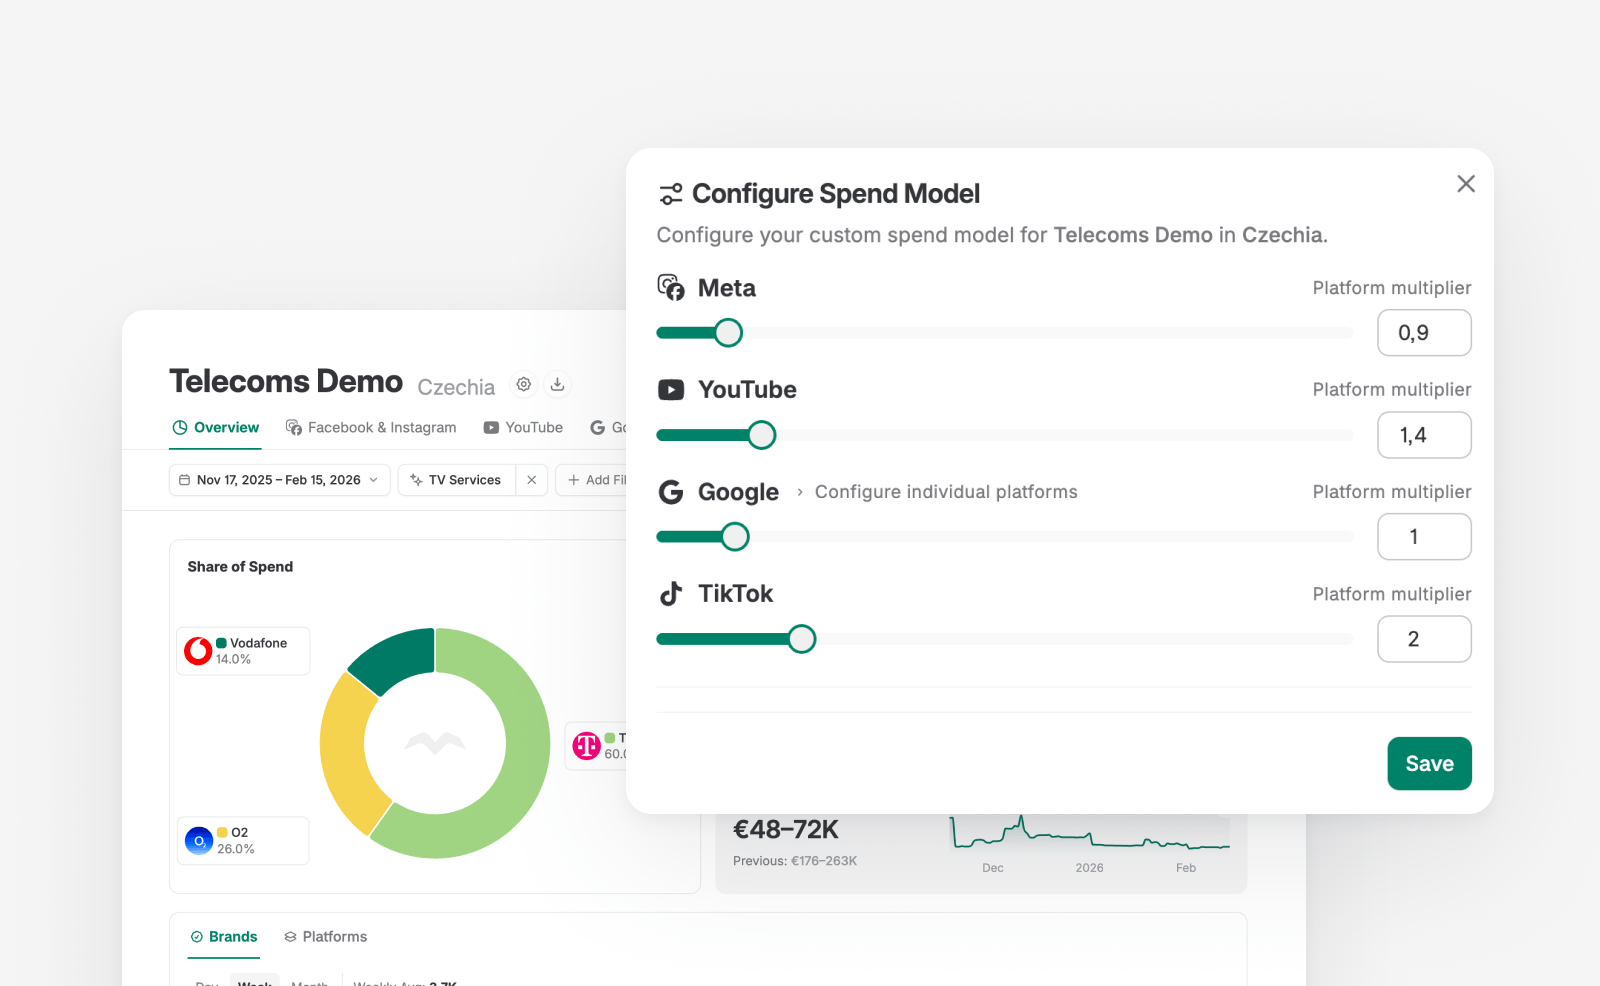
Configure Spend Model is a feature that lets you calibrate how estimated spend is distributed across platforms within your dashboard. Instead of relying solely on our global model, you can adjust platform-level multipliers based on your own market knowledge, benchmarks, and planning assumptions. This preserves consistency while providing flexibility to reflect local conditions and strategic priorities.
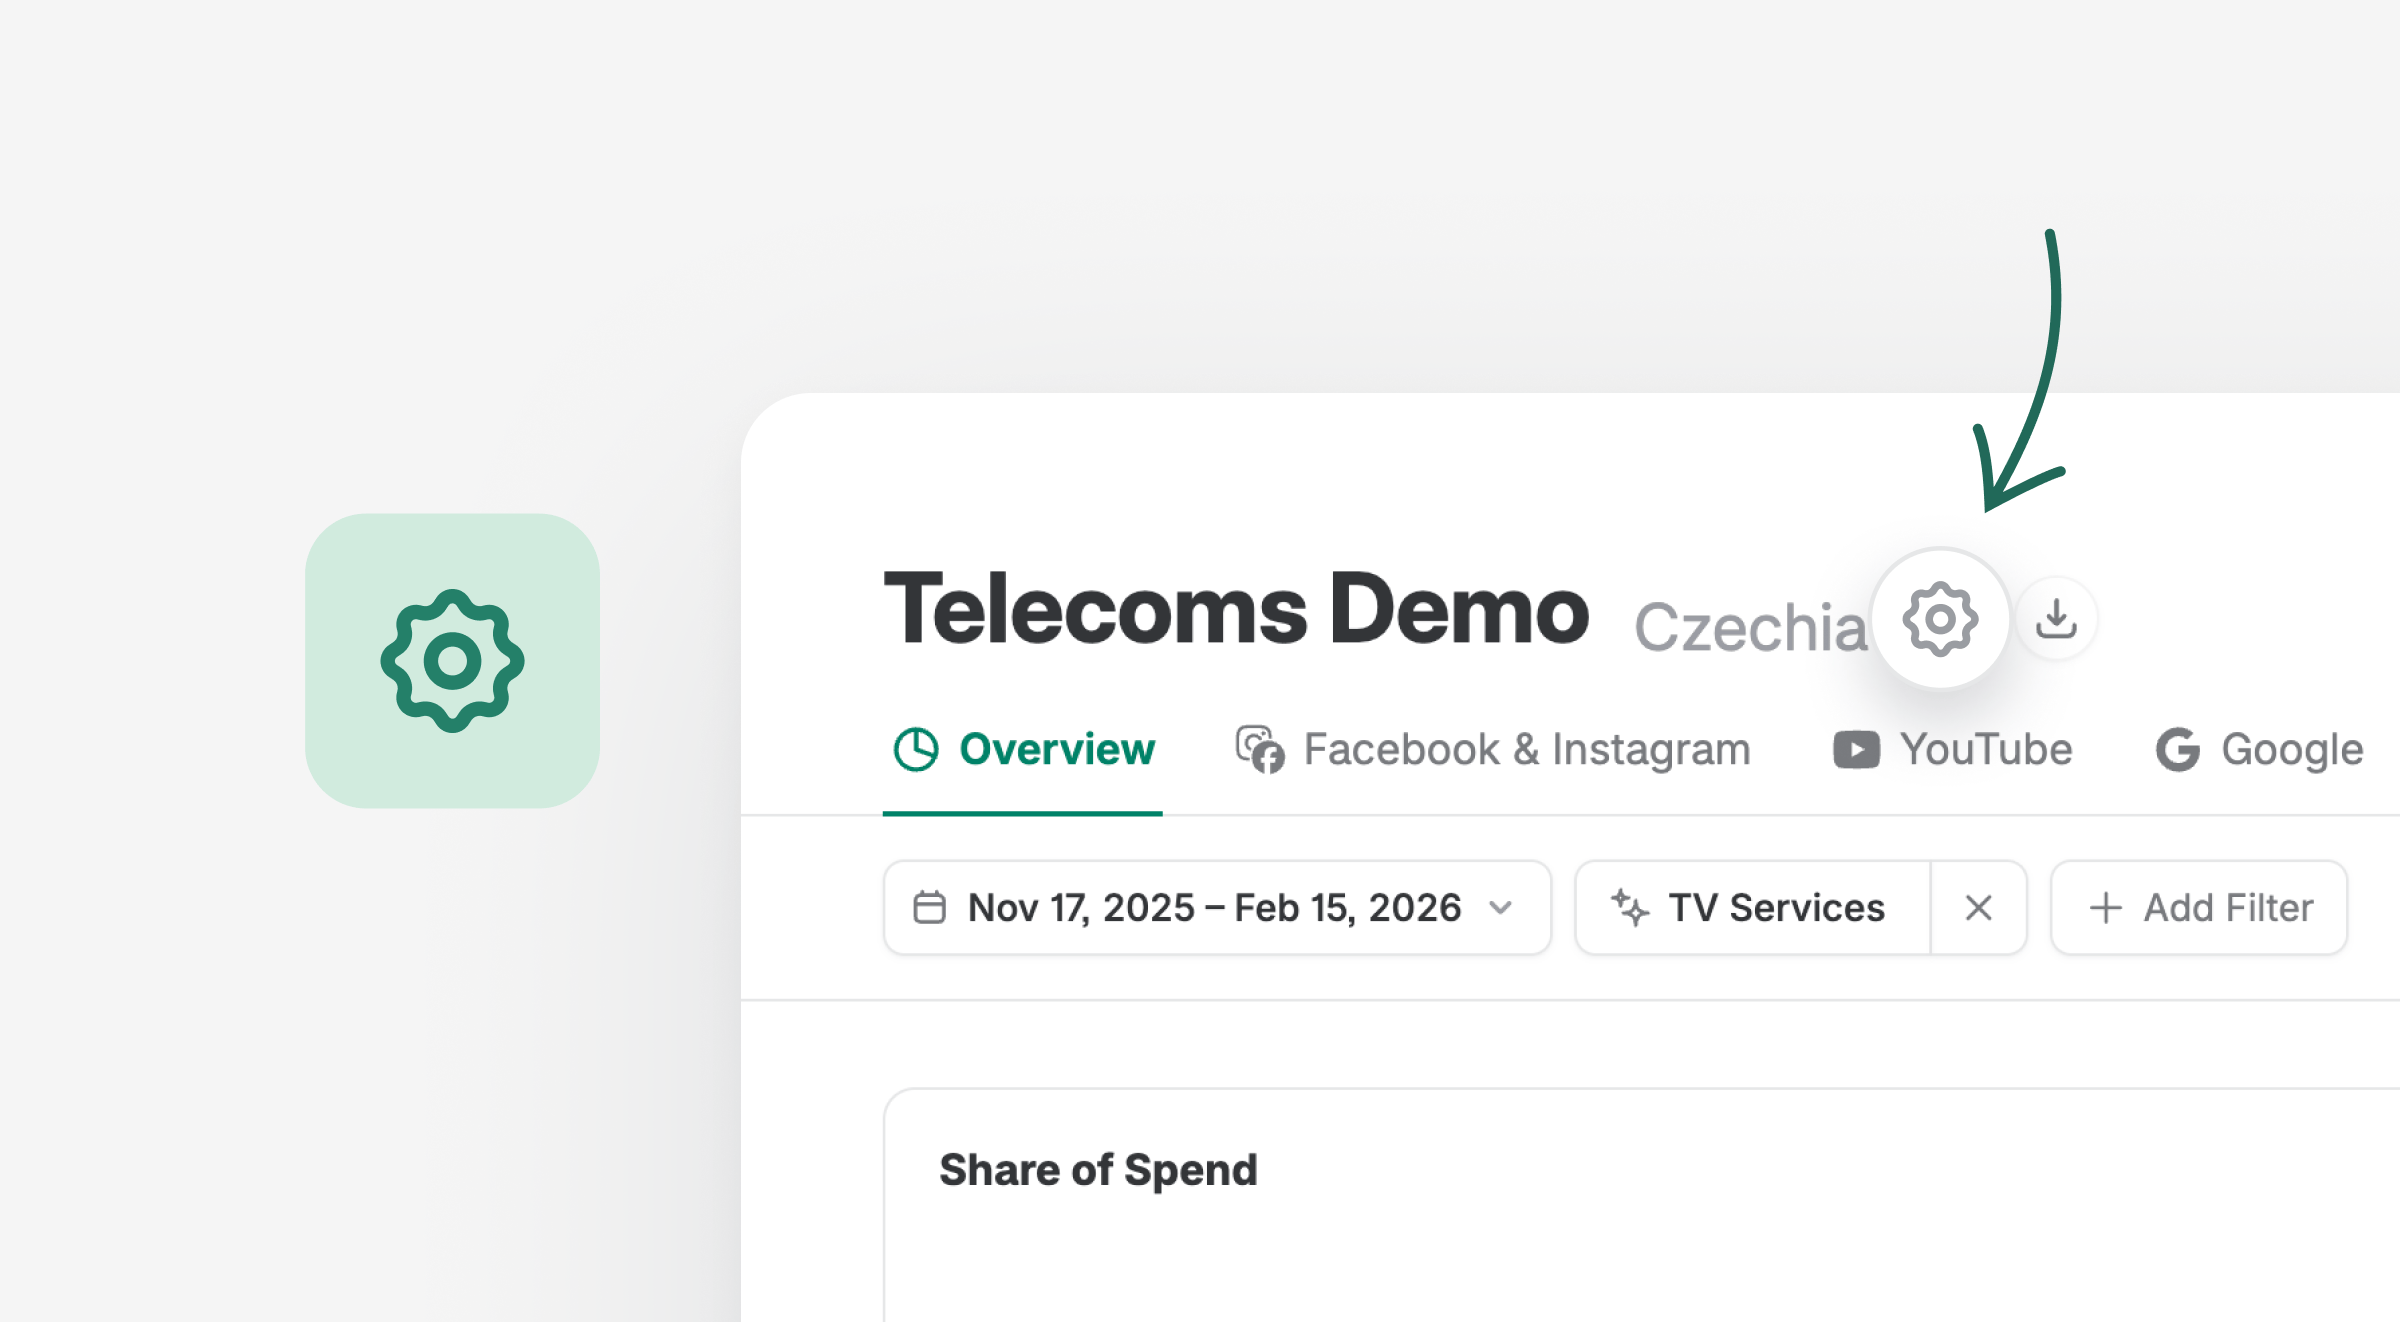
Where to find it: From the main dashboard, click the settings icon (⚙️) next to the dashboard name at the top of the page. The configuration applies to the selected dashboard and country.
How multipliers work
Each advertising platform has an associated spend multiplier that influences how detected ad activity is converted into estimated spend.
- Increasing a multiplier increases the estimated spend attributed to that platform.
- Decreasing it lowers the attributed spend.
- The default multiplier for every platform is 1.0.
Multipliers are available for Meta, YouTube, Google, and TikTok. Within Google, individual sub-platforms — Search, Maps, Play, Shopping, and Display Network — can be adjusted separately.Important: When you change a multiplier, the same factor is applied to all brands and competitors on that platform — so the competitive comparison remains consistent. You are essentially re-anchoring the model to better reflect your market's price levels, not changing the relative positioning between brands.
How to calibrate multipliers — recommended approach
This is the question we hear most: “How do I decide what values to set?”
Below is a practical, step-by-step methodology that works especially well if you have access to internal media platform data (e.g. your own campaign reporting system, ad platform dashboards, or any tool with raw data by market, brand, and platform).
Step 1 — Pick a reference period
Choose a recent time window (e.g. the last 3–6 months) where you have reliable internal spend data for your own brands, broken down by platform. A longer window smooths out seasonal and campaign-goal fluctuations — awareness campaigns and conversion campaigns can have very different CPMs, so averaging over a longer period produces a more stable multiplier.
Step 2 — Compare platform by platform
For each platform, compare Ravineo's estimated spend for your brand(s) against your actual internal spend over the same period. Then calculate the ratio:
Multiplier = Your actual spend ÷ Ravineo's estimated spend
For example: if Ravineo estimates €50,000 on Meta but your real spend was €75,000, then your Meta multiplier is 75,000 ÷ 50,000 = 1.5. If Ravineo estimates €10,000 on TikTok but you actually spent €8,000, the multiplier is 8,000 ÷ 10,000 = 0.8.
Repeat this for each platform (Meta, YouTube, Google, TikTok) and, if relevant, for Google sub-platforms.
Step 3 — Apply and verify
Enter the multiplier values in the Configure Spend Model panel and click Save. Then review the updated dashboard:
- Does your own brand's estimated spend now roughly match your internal numbers?
- Do competitor spend levels look plausible based on your market knowledge?
- Does the platform mix distribution (e.g. % Meta vs. % YouTube) feel realistic?
You may need to iterate once or twice. The goal is not pixel-perfect accuracy — it's getting the data into the same ballpark so that share-of-spend and competitive comparisons are meaningful.
Step 4 — Roll out to other markets
Multipliers are set per country, per dashboard. Austria can have different multipliers than Belgium. If you manage multiple markets, repeat this process for each one. Once you've calibrated one market, the rationale and methodology can be shared with other categories or teams using Ravineo — since all teams in the same market and segment will typically see similar pricing dynamics.
Tip — what if you don't have exact spend data? You can still calibrate directionally using industry benchmarks (e.g. published CPM ranges for your market or vertical), agency rate cards, or even qualitative knowledge like "in our market, Meta is notably more expensive than the European average." Even a rough calibration brings significant improvement over the default.
Scope and impact
All spend model adjustments are applied at the country and dashboard level. This means:
- Changes affect all spend-based views within the selected dashboard
- Other dashboards and countries remain unchanged
- Updates are visible to all users who have access to the dashboard
After updating multipliers and clicking Save, changes are applied immediately across:
- Total estimated spend
- Platform-level spend distribution
- Share of spend views
- Individual ad and brand spend estimates
Things to keep in mind
Multipliers are static. They don't automatically adjust when campaign goals shift (e.g. awareness campaigns in Q1 with low CPMs vs. conversion campaigns in Q2 with high CPMs). For this reason, we recommend calibrating over a longer reference period that blends different campaign types — this produces a multiplier that works well on average across the year.
Changes affect all users. Everyone with access to the dashboard sees the updated spend estimates. We recommend designating one or two people per market as the administrators for multiplier settings, and aligning within your team before making changes.
Access is granted on request. Because spend multipliers directly influence estimated spend and all derived views, the Configure Spend Model feature is enabled by your Ravineo contact. Ask your account manager to activate it.
Improve spend estimates with My Analytics
For even better accuracy, connect your ad accounts in My Analytics. Ravineo will then use your own campaign data to refine our spend estimation algorithm specifically for your dashboard. This is the most effective way to improve accuracy, as it lets our model learn from your actual data rather than relying on market-wide benchmarks. This feature is in beta.
If you're unsure how to approach spend calibration or would like guidance on the best setup for your markets, our team is happy to walk you through it on a short call. Reach out to your Ravineo contact to schedule.
Ravineo & Meta Metrics Comparison
Metric | Ravineo | Meta (Facebook & Instagram) |
|---|---|---|
Reach Calculation | Cumulative Unique Reach: Sum of the unique reach for each individual ad. Captures the total exposure across multiple ads. | Deduplicated Unique Reach: Tracks the actual number of distinct individuals reached across multiple ads, eliminating duplicates. |
Example (10 Ads) | If 10 ads each reach 1M people, Ravineo reports a total reach of 10M. | Meta would show a deduplicated reach of, for example, 1.4M unique people across the 10 ads. |
Deduplication | No Deduplication: Summing up the unique reach of each ad provides a standardized comparison of total exposure. | Deduplication Applied: Meta deduplicates users across ads within their platform, removing repeat counts of the same individual. |
Share of Ads Voice | Represents the total attention captured by summing the reach of all ads. Gives a comprehensive view of campaign reach. | Focus on Unique Reach: Meta’s deduplication aims for exact precision within the Meta ecosystem, reporting the total unique exposure. |
Comparison Strength | Cross-platform, comprehensive: Share of Ads Voice works across multiple platforms, giving a full-market view. | Platform-limited: Meta’s reach data is specific to its ecosystem, limiting comparisons outside of Facebook/Instagram. |
Data Limitation | Cross-Ad Comparison Possible: Ravineo does not deduplicate across multiple ads due to privacy and technical constraints. | Single-Ad Focus: Meta focuses on deduplicating reach within individual campaigns but doesn’t offer comprehensive cross-platform views. |
Read Next: