Detect every single brand in every single piece of influencer content.
Most influencers don’t officially declare brand partnerships in their content — or tag the brand at all. Brands are boosting influencers using dark, invisible boosts.
- The influencer might audibly mention the brand, but they don’t even show it
- A t-shirt with a logo might be visible for a split second in a video
- The influencer might have a promoted product on their desk
- They can be running a boosted ad which is at the same time hidden from the influencer’s profile
Ravineo understands the full influencer market by detecting all boosts and watching all videos with AI.
Partnership Detection
From boosts, to audible mentions, tags, and visibly present brands, Ravineo Influencer Analytics is the only tool that reveals all levels of influencer-brand cooperation.
We watch every post, video and image with AI. This allows us to build your Share of Influence, measure risks in posts, perform creative audits, and reveal all brand affiliations.
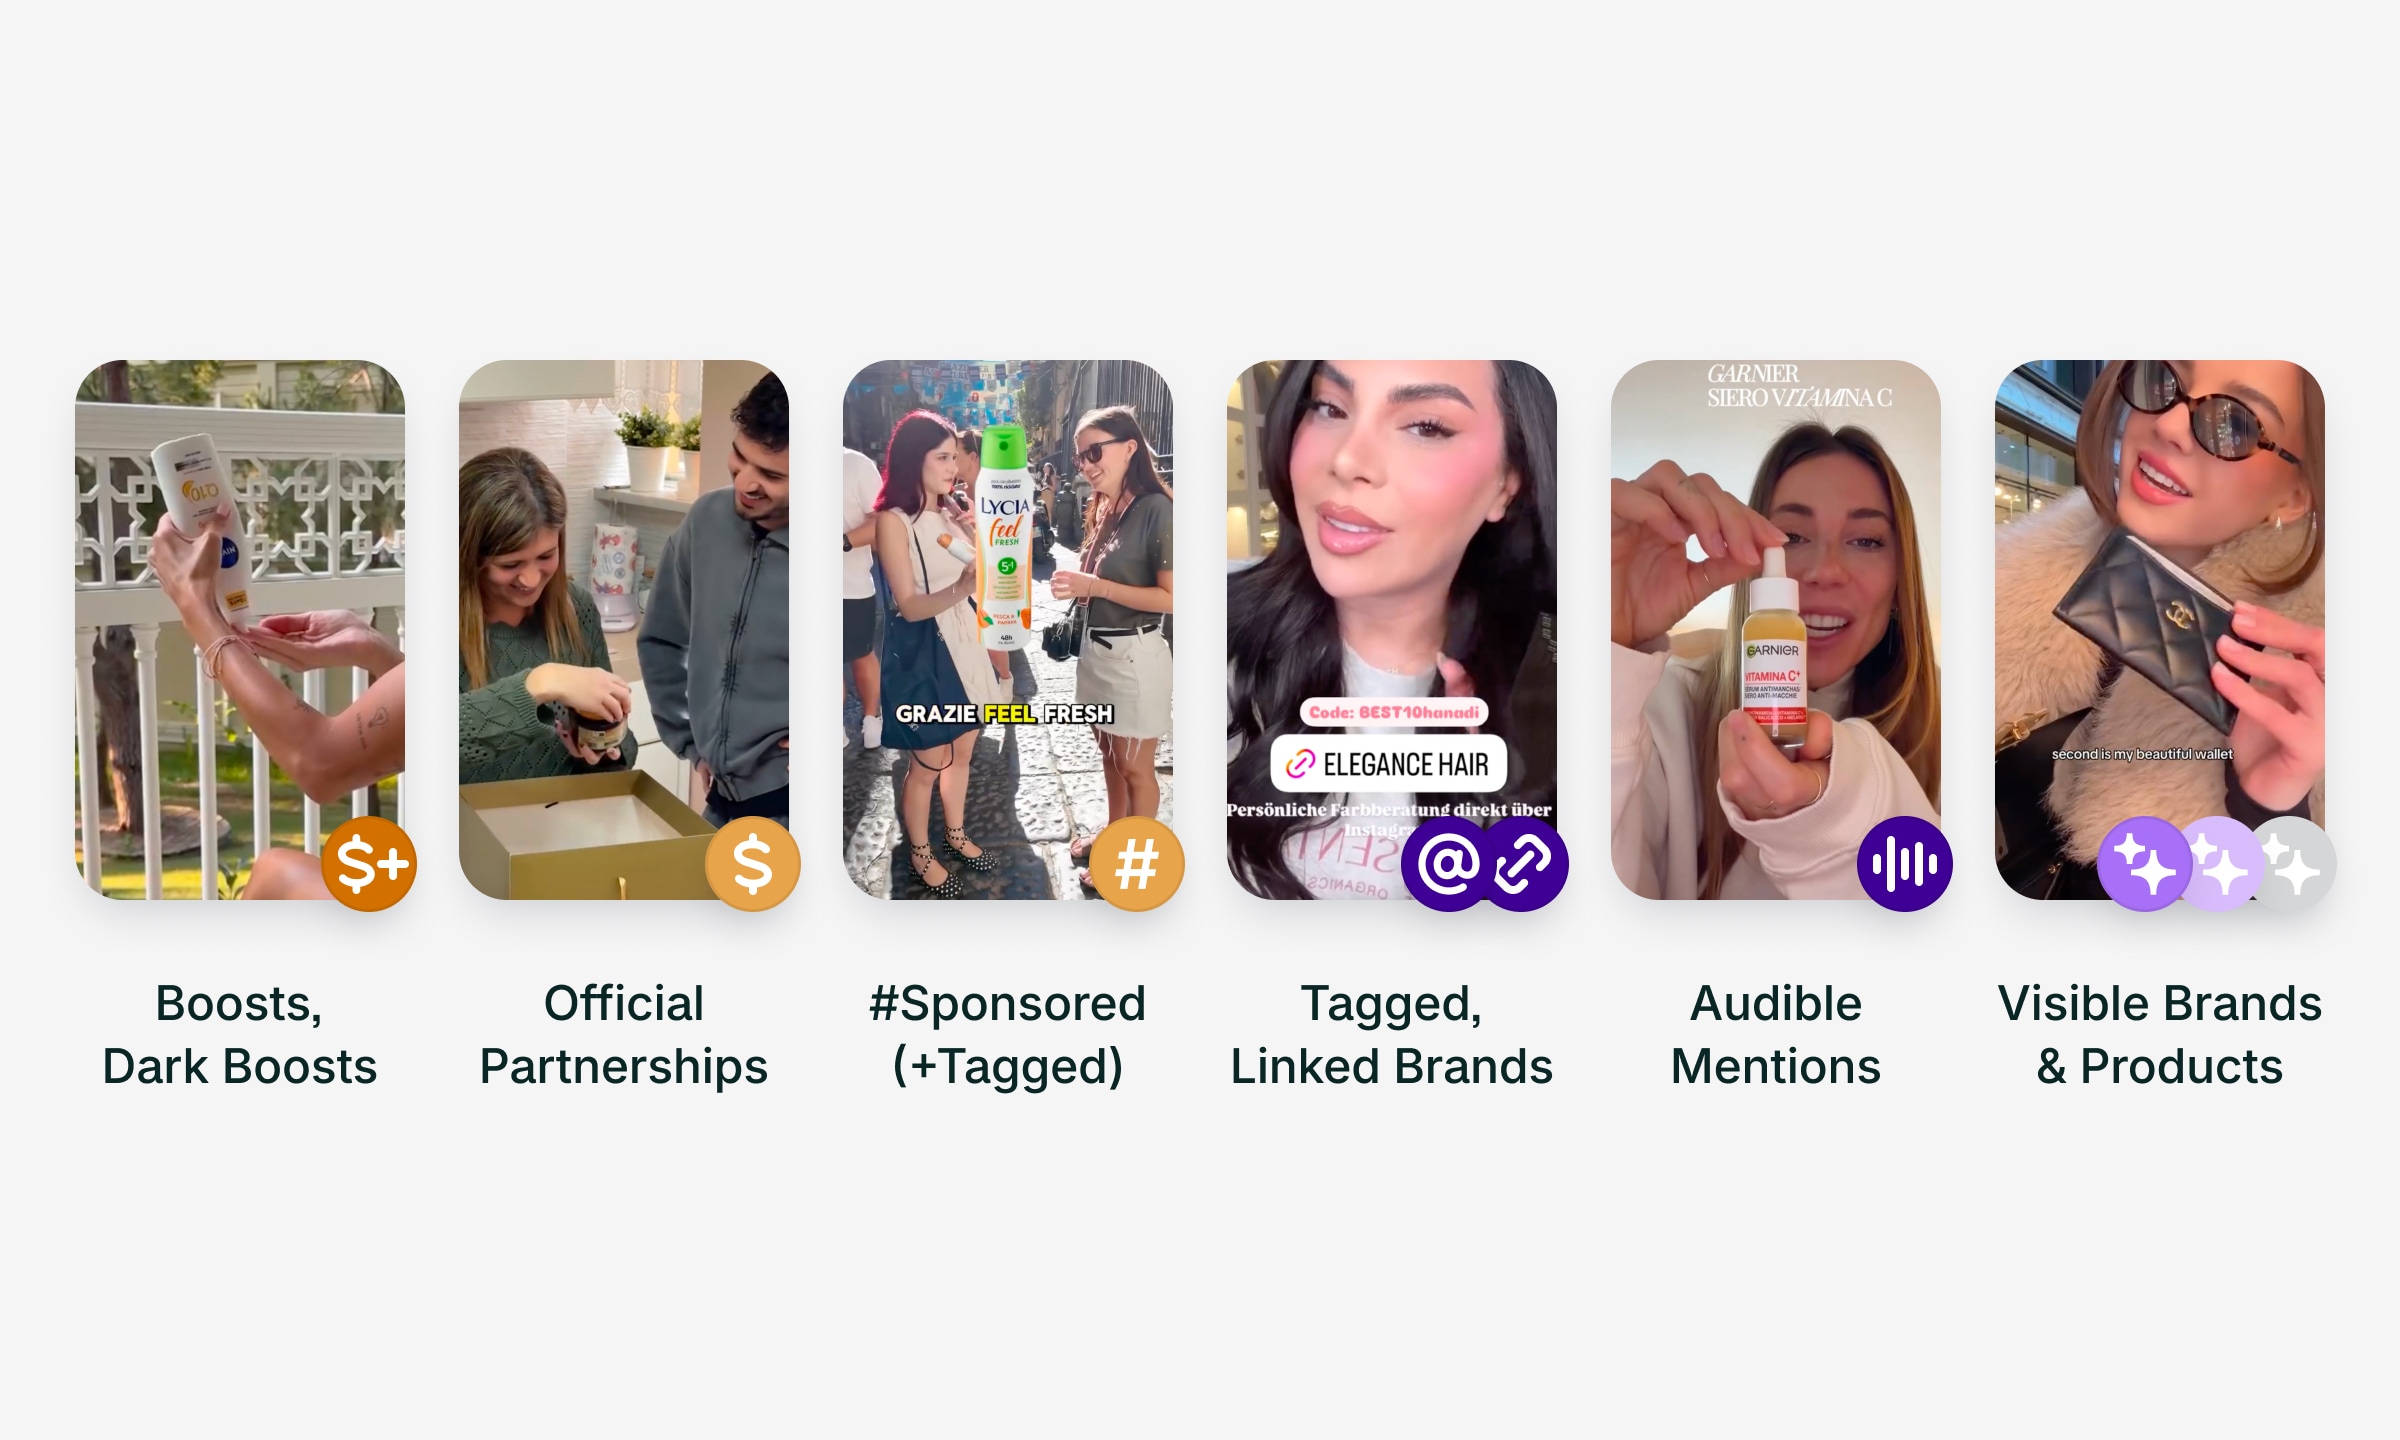
Boosted Ads
The brand bought additional paid reach for an influencer’s organic post, or ran it as a partnership ad. This includes dark boosts, which are ads hidden from influencer profiles.
Official Partnerships, #Sponsored
Official partnership: The influencer officially declared the post as paid partnership with the brand.
#Sponsored: The influencer tagged the brand’s profile and included a sponsorship-related hashtag such as #sponsored, #ad, or #partnership.
Tagged, Linked
Tagged: The influencer tagged the brand’s profile in the post.
Linked: The influencer added a link to the brand's website, including directly embeding it in the media (detected by AI).
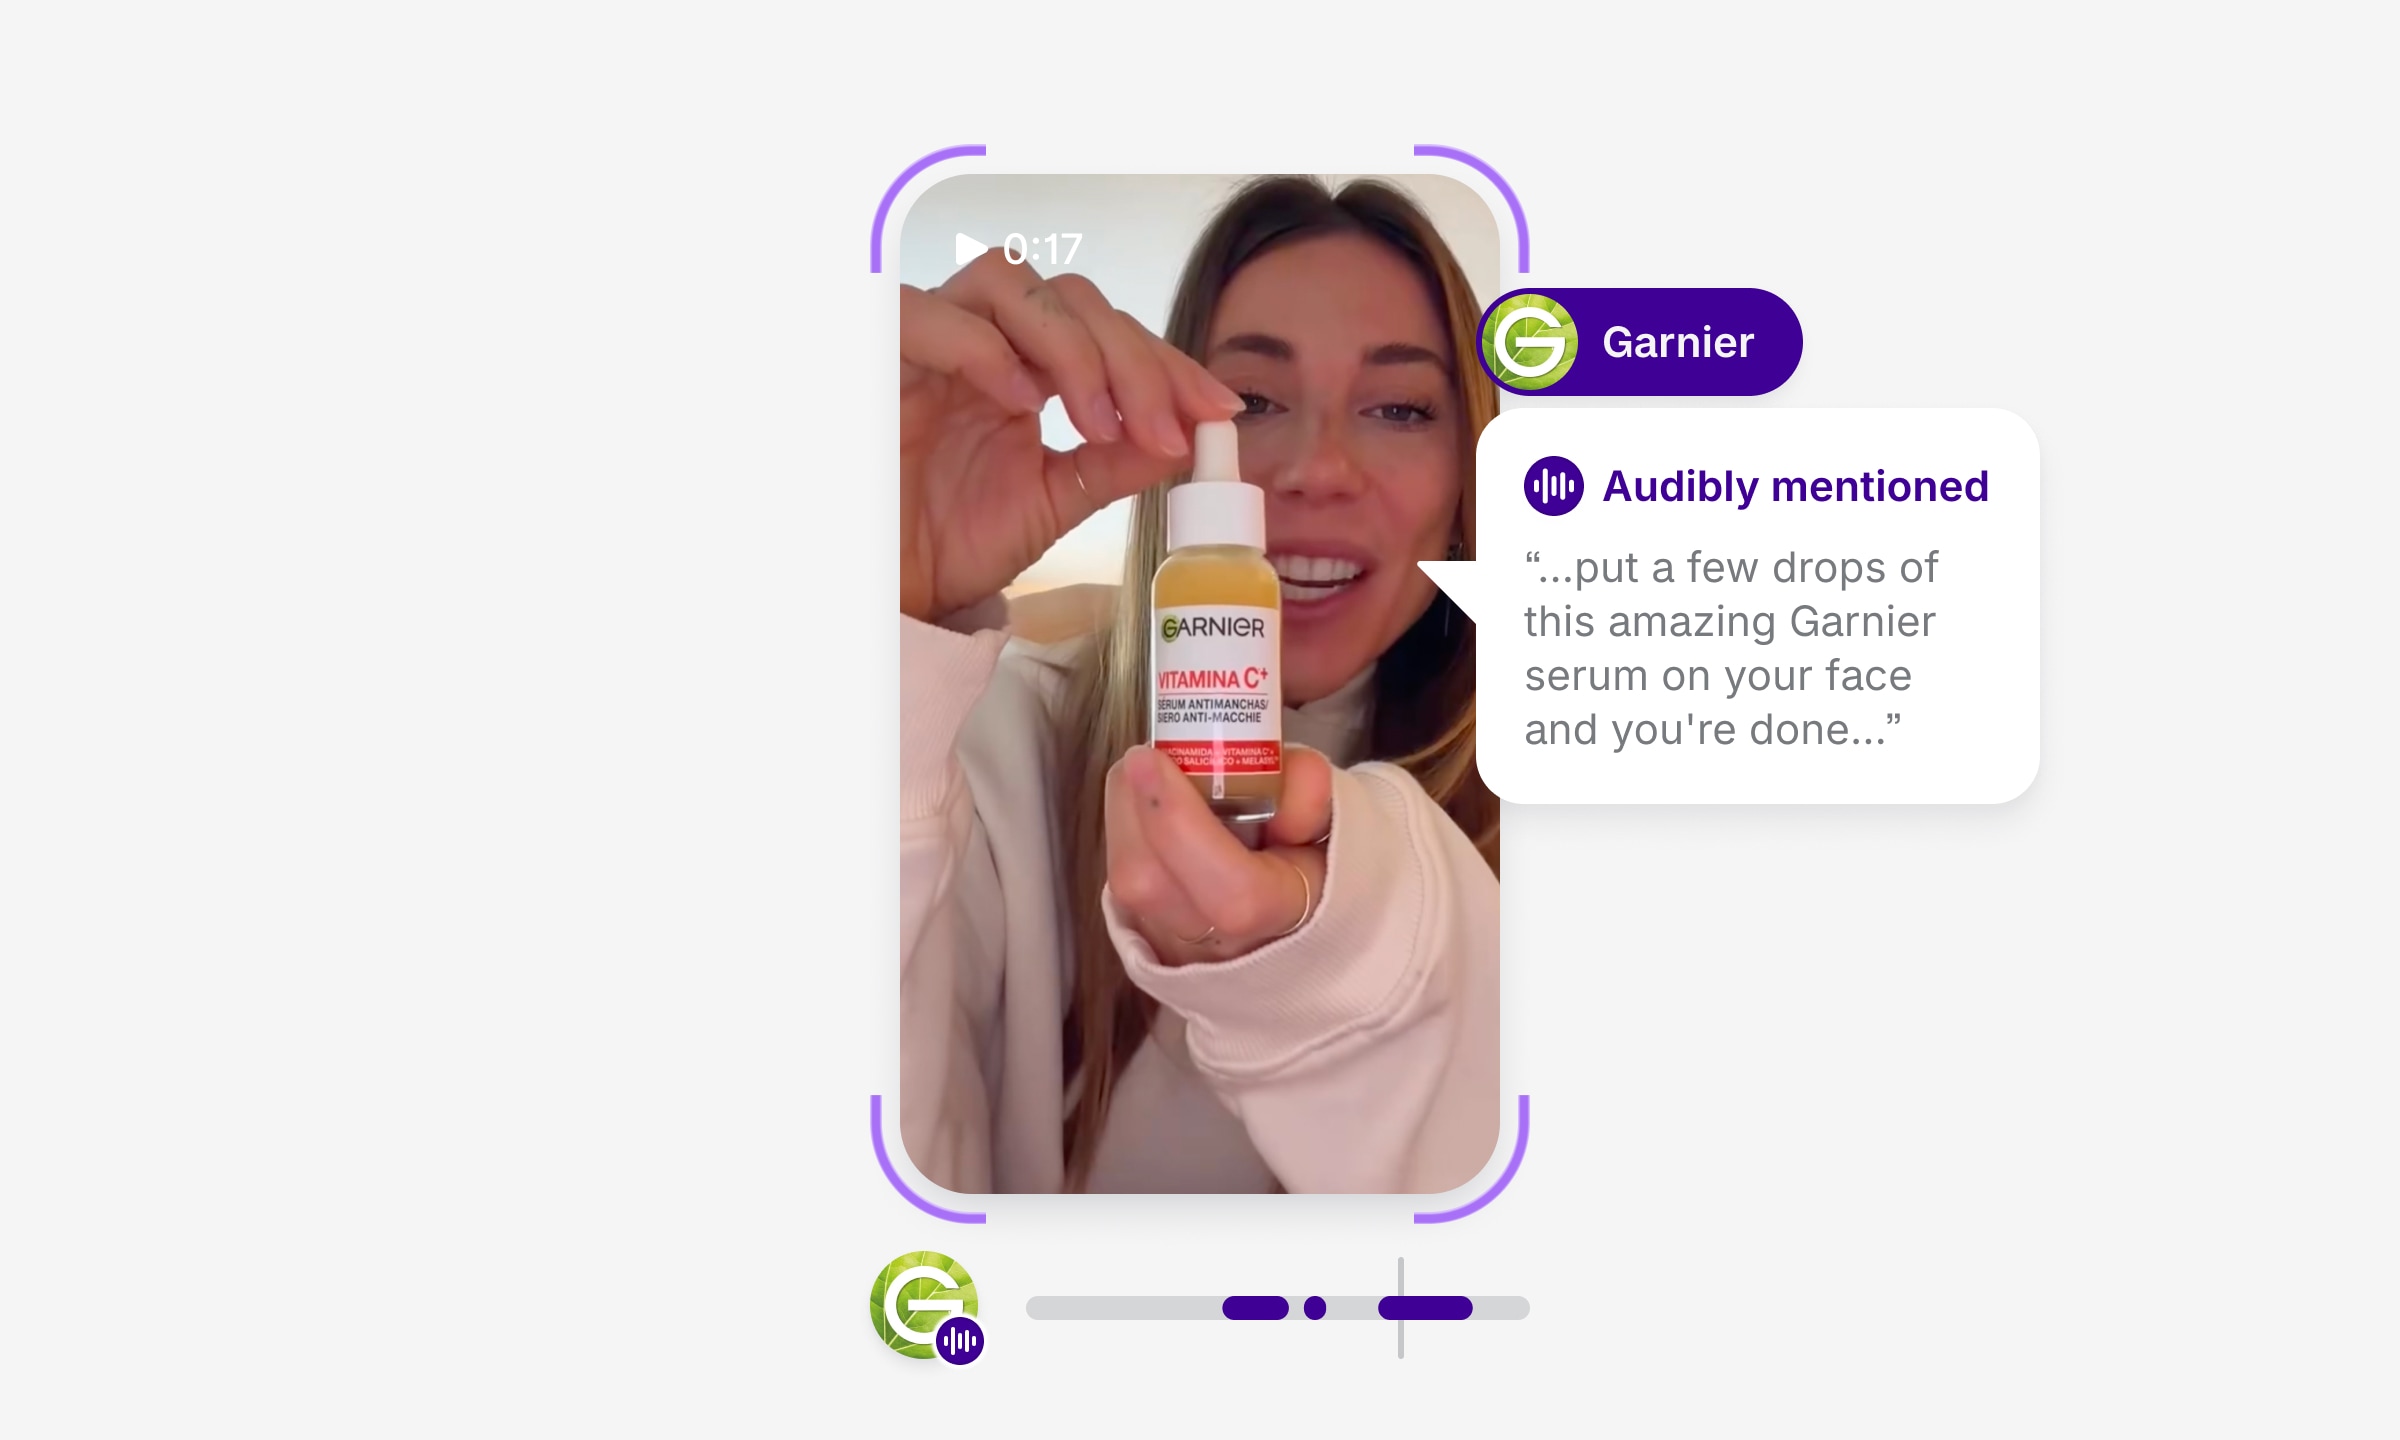
Audibly Mentioned
The brand was clearly mentioned out loud. We catch all mentions of the brand with precise timestamps and sentiment detection.
Brand Exposure
Official partnerships easily stand out.
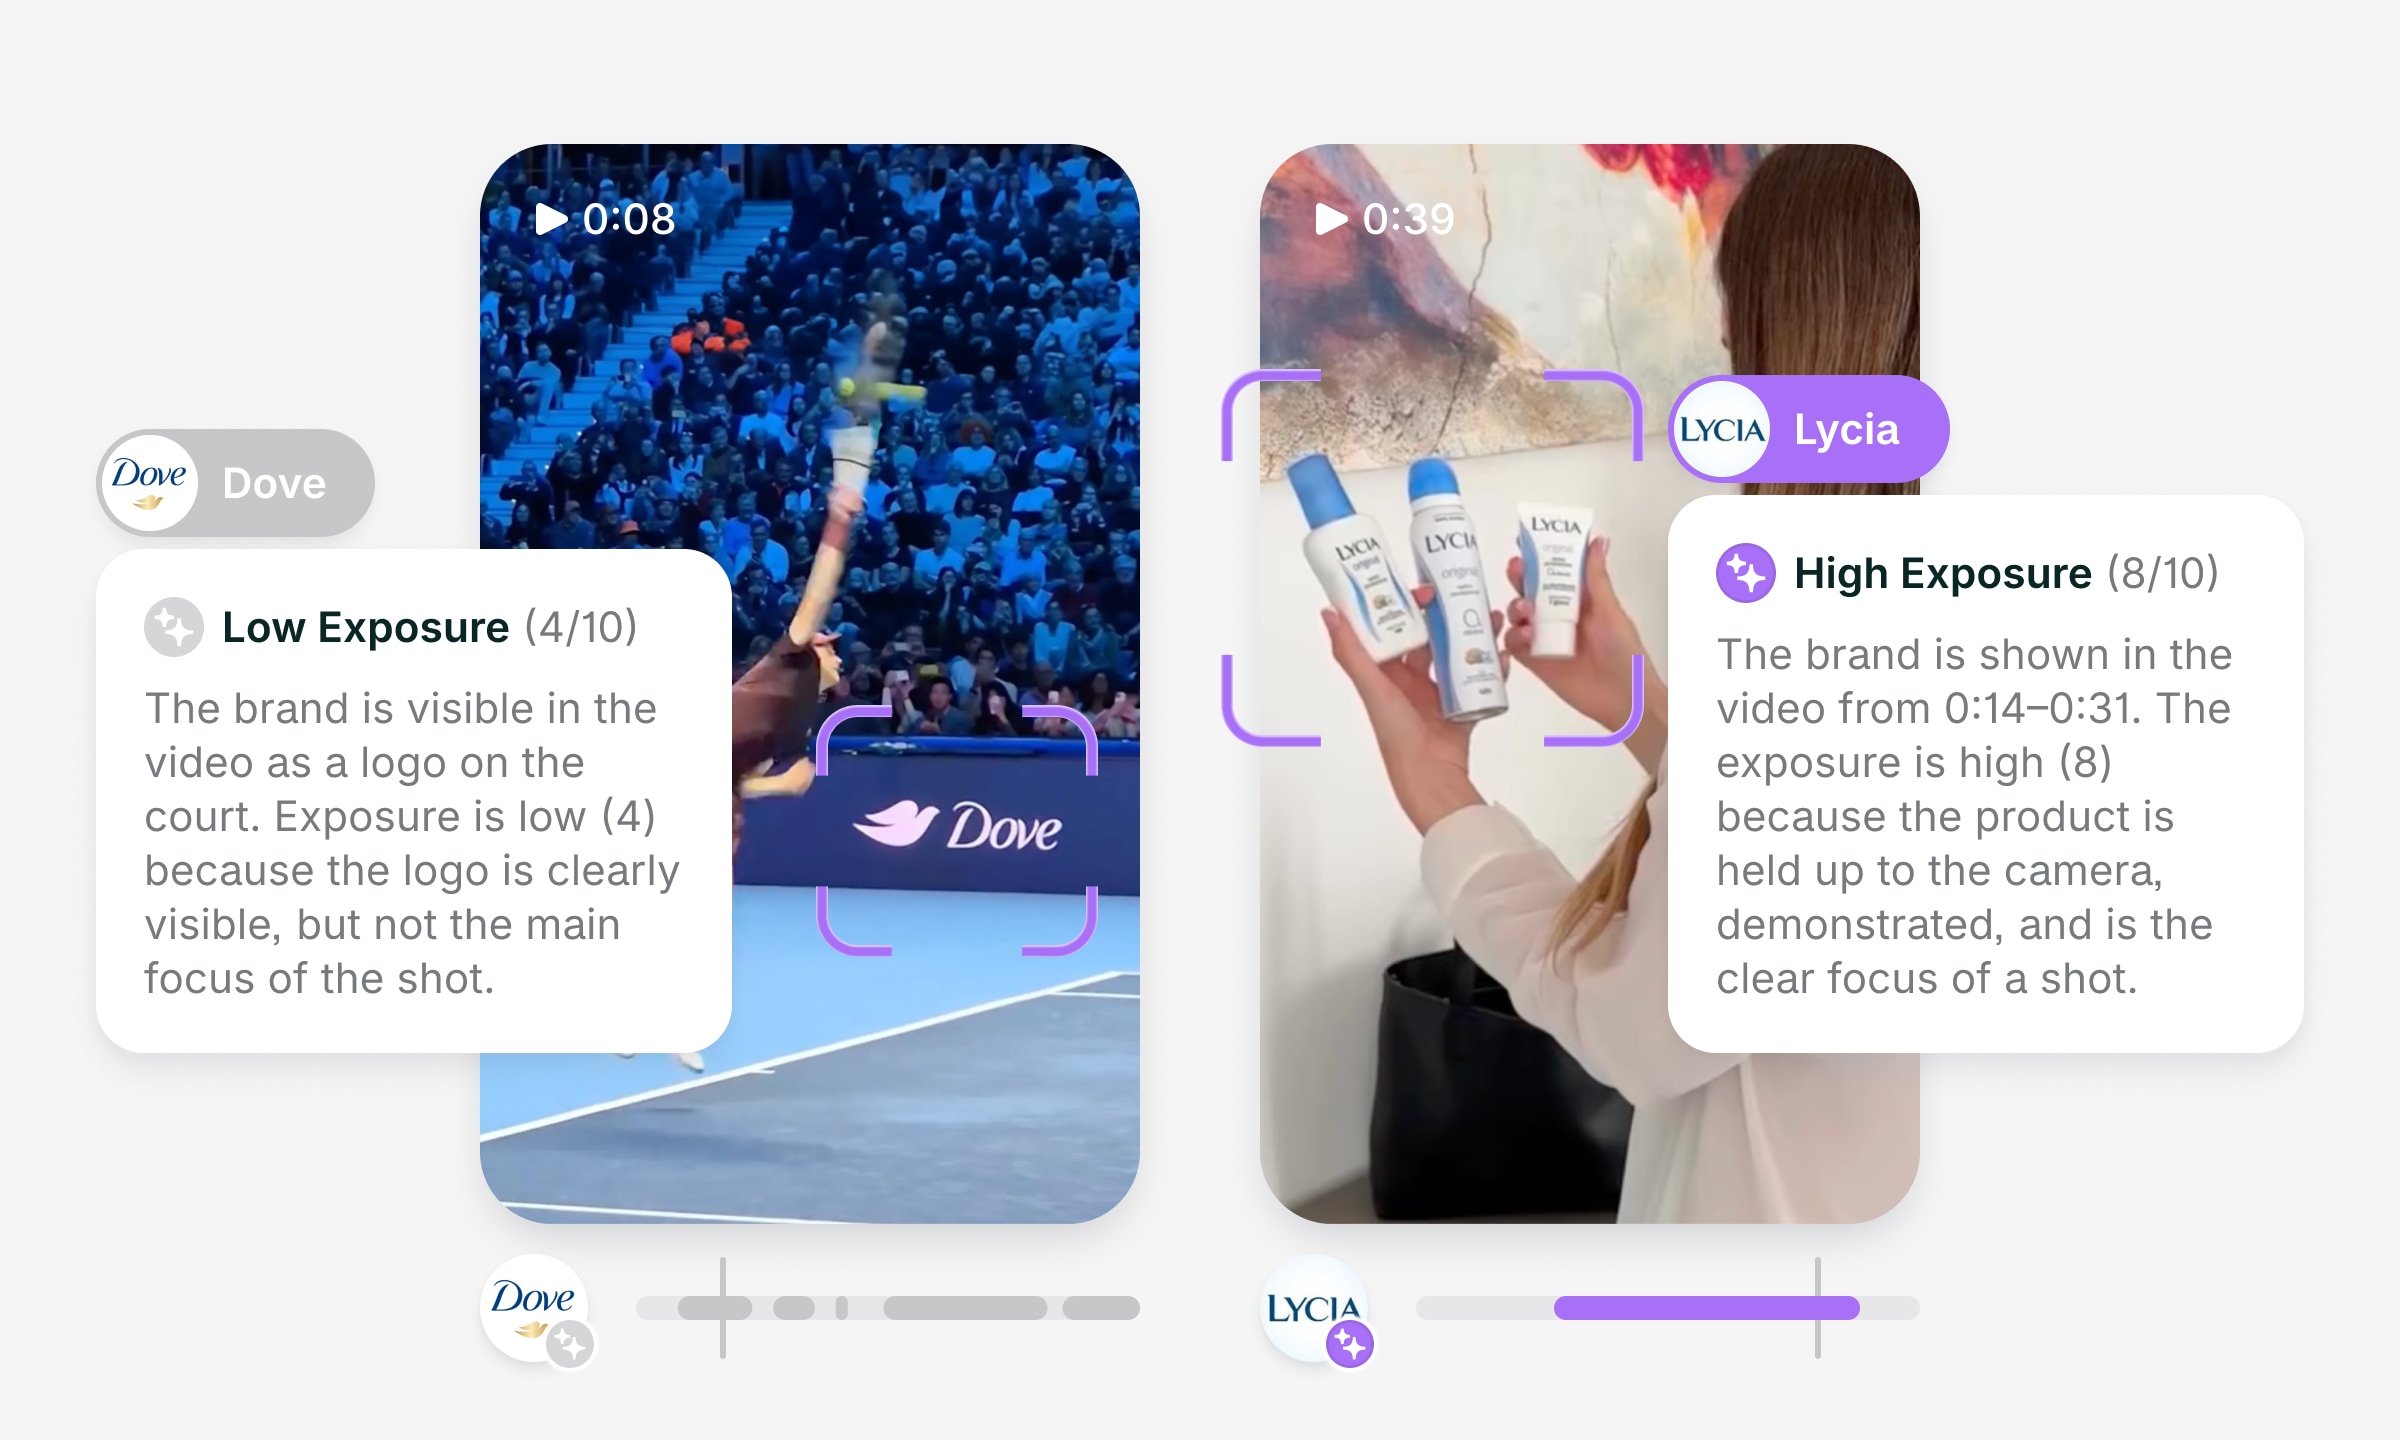
For the rest, the AI assigns an exposure index (1–10) to each brand, based on how strongly it appears in the post, image or video.
- High Exposure (8–10): Strongly present brand, suggesting a likely partnership.
- Moderate Exposure (5–7): Moderately present brand, these suggest intentional or not.
- Low Exposure (1–4): The brand is not emphasized, but still present. E.g. It might be seen as a logo in the background or mentioned in passing.
On content thumbnails, we always show the strongest form of mention that we detected. Boosted being the highest and Low Exposure having the least priority.
Ravineo & Meta Metrics Comparison
Metric | Ravineo | Meta (Facebook & Instagram) |
|---|---|---|
Reach Calculation | Cumulative Unique Reach: Sum of the unique reach for each individual ad. Captures the total exposure across multiple ads. | Deduplicated Unique Reach: Tracks the actual number of distinct individuals reached across multiple ads, eliminating duplicates. |
Example (10 Ads) | If 10 ads each reach 1M people, Ravineo reports a total reach of 10M. | Meta would show a deduplicated reach of, for example, 1.4M unique people across the 10 ads. |
Deduplication | No Deduplication: Summing up the unique reach of each ad provides a standardized comparison of total exposure. | Deduplication Applied: Meta deduplicates users across ads within their platform, removing repeat counts of the same individual. |
Share of Ads Voice | Represents the total attention captured by summing the reach of all ads. Gives a comprehensive view of campaign reach. | Focus on Unique Reach: Meta’s deduplication aims for exact precision within the Meta ecosystem, reporting the total unique exposure. |
Comparison Strength | Cross-platform, comprehensive: Share of Ads Voice works across multiple platforms, giving a full-market view. | Platform-limited: Meta’s reach data is specific to its ecosystem, limiting comparisons outside of Facebook/Instagram. |
Data Limitation | Cross-Ad Comparison Possible: Ravineo does not deduplicate across multiple ads due to privacy and technical constraints. | Single-Ad Focus: Meta focuses on deduplicating reach within individual campaigns but doesn’t offer comprehensive cross-platform views. |
Read Next: