See how your retail partners are advertising your products – and how much.
What is the Retail Dashboard?
Your brand's visibility doesn't stop at your own ad accounts. Retailers and eCommerce partners run ads featuring your products every day — often spending more than you do.
The Retail Dashboard gives you full visibility into how your retail partners are advertising your products across Meta (Facebook & Instagram), Google, YouTube, and TikTok.
For the first time, you can see which retailers are promoting your brand, how much they're spending, through which platforms, and in which product categories.
Why it matters
In many markets, partner ads outperform brand ads in reach.
- For example, store ads for a major electronics brand achieve roughly 2.5× the average reach per creative compared to the brand's own ads.
- For professional and prestige beauty brands, more than half of all ad visibility often comes through retail partners rather than the brand's own campaigns. We've seen brand-to-partner splits of up to 30/70 across leading prestige brands.
- Some brands grow entirely through partner advertising. A fast-growing K-Beauty brand gained 27% Share of Voice in Germany through store ads alone — while running 0% of its own ads.
What you can see
The Retail Dashboard answers three key questions:
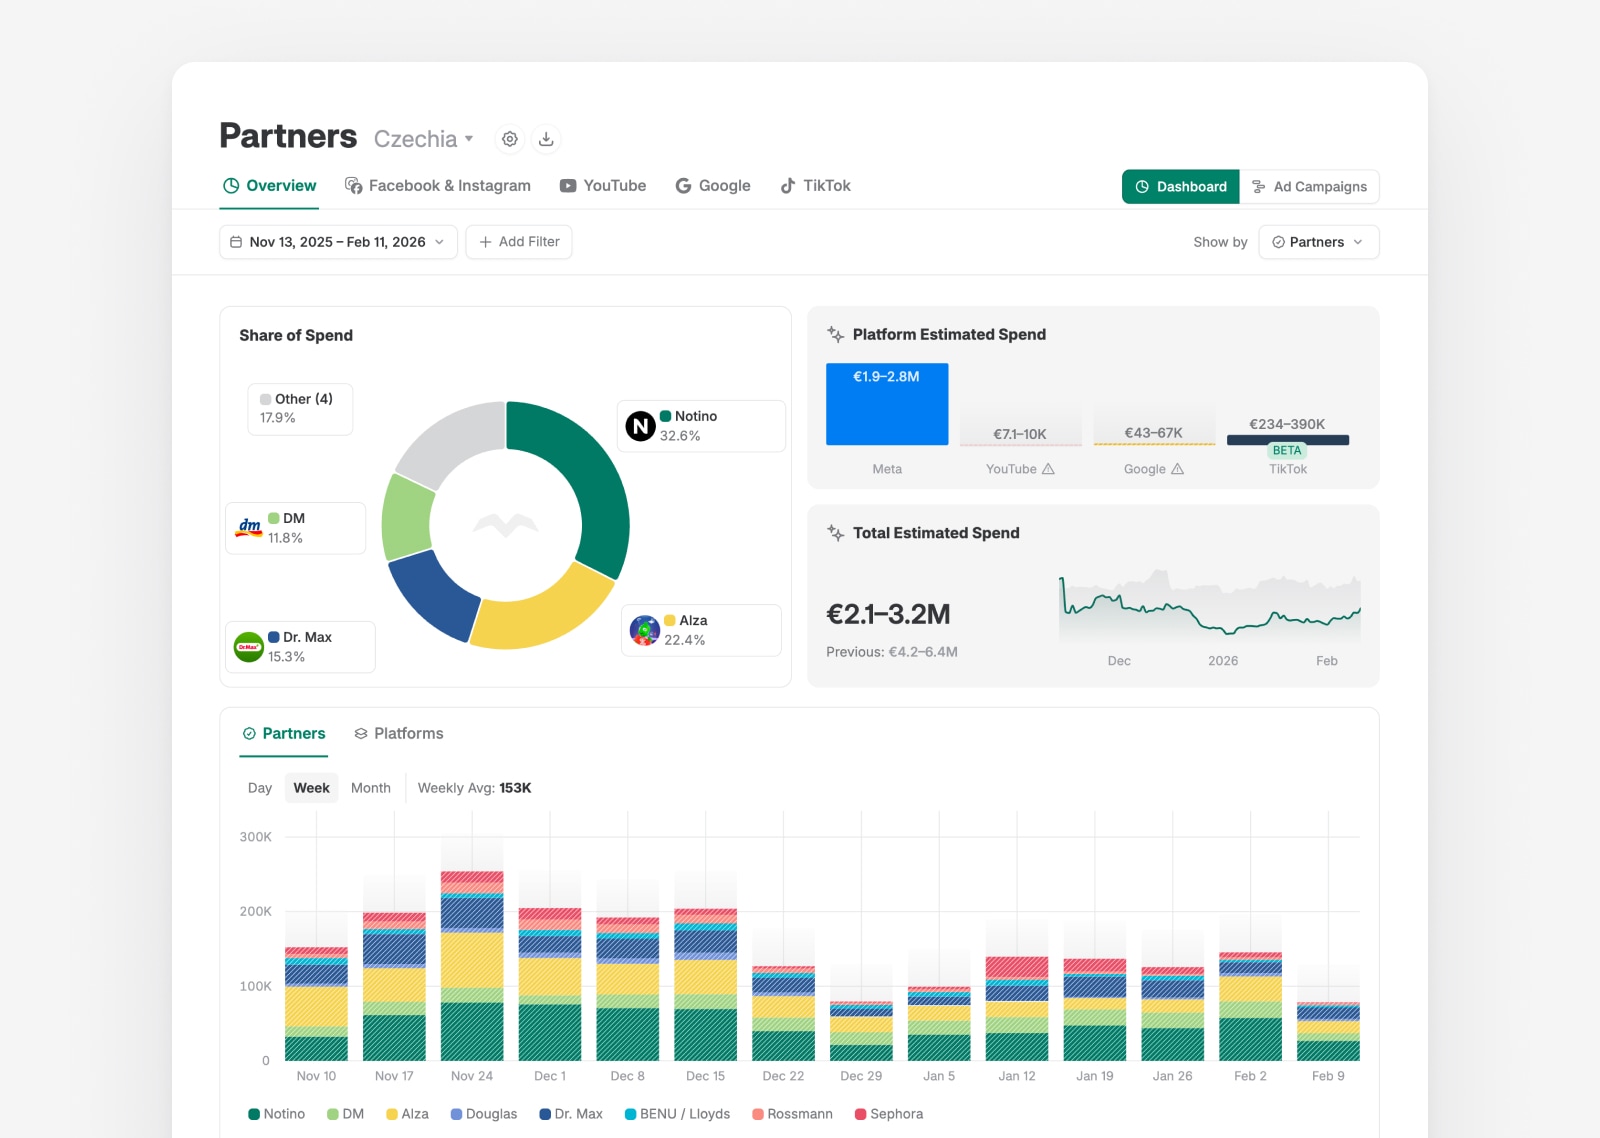
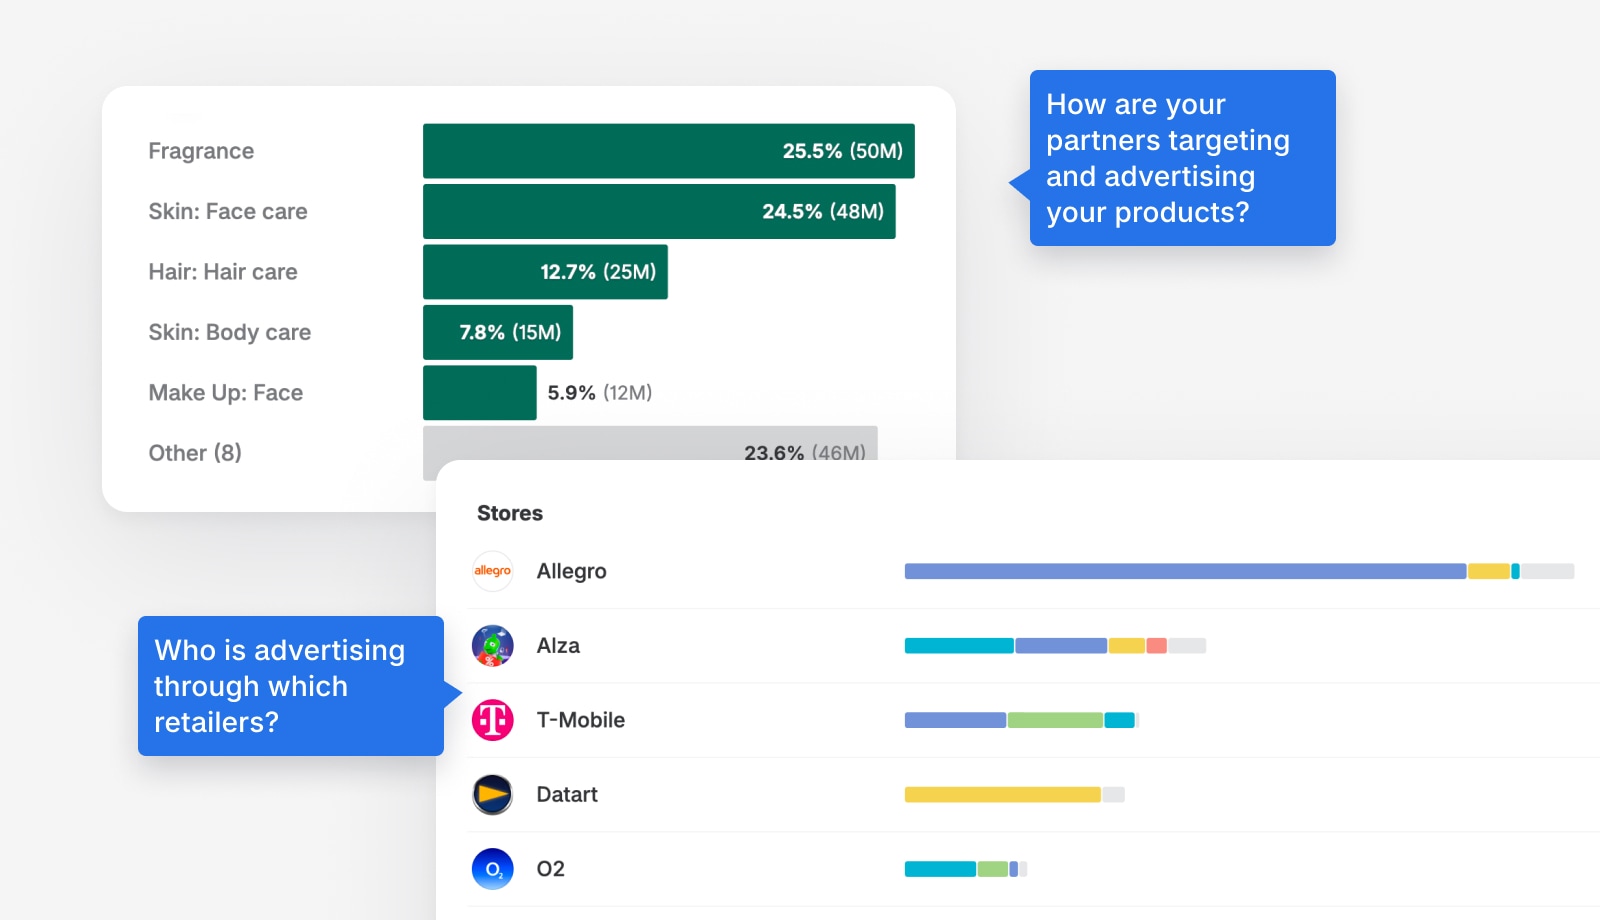
How are your partners targeting and advertising your products?
See each partner's estimated spend, number of ads, and platform breakdown. Compare retailers side by side and track their activity over time.
Who is advertising through which retailers?
The Share of Ads Voice chart shows the split of ad attention across your retail partners. Filter by product category to see which retailers dominate in fragrance, skincare, hair care, and more.
Which brands are retailers promoting, and how?
See which brands within your portfolio each retailer is pushing, and through which platforms — giving you clarity over co-op spend and partner alignment.
Retailers on Google
Retailers play a particularly significant role on Google. In Germany, approximately 26% of all Google ad impressions featuring beauty brands are run by retail partners, not the brands themselves.
Without a Retail Dashboard, this entire layer of your brand's bottom-of-funnel visibility is invisible to you.
How it works
The Retail Dashboard is part of your Ravineo Ads Research setup. We configure it with your retail partners and product categories, and the AI automatically detects and categorizes all partner ads featuring your products.
You can view data by partner, by platform, by product category, and over time — using the same powerful filters and Share of Ads Voice and Estimated Spend indicators you already know from your brand dashboards.
The Retail Dashboard uses the same spend estimation and AI categorization as your regular dashboards. If you already have AI Categorization set up, the same categories apply to partner ads too.
Large general retailers like Amazon or other big eCommerce platforms advertise thousands of products across many categories. When these retailers are included on your dashboard, the majority of their ads may not feature the brands you are tracking at all and will fall into the "unknown" category. This is expected — use the "Hide unknown" switch or category filters to focus on the ads that are relevant to your brand.
Get access
The Retail Dashboard requires a custom setup for your brand and market. Get in touch with us to add it to your Ravineo subscription.
Ravineo & Meta Metrics Comparison
Metric | Ravineo | Meta (Facebook & Instagram) |
|---|---|---|
Reach Calculation | Cumulative Unique Reach: Sum of the unique reach for each individual ad. Captures the total exposure across multiple ads. | Deduplicated Unique Reach: Tracks the actual number of distinct individuals reached across multiple ads, eliminating duplicates. |
Example (10 Ads) | If 10 ads each reach 1M people, Ravineo reports a total reach of 10M. | Meta would show a deduplicated reach of, for example, 1.4M unique people across the 10 ads. |
Deduplication | No Deduplication: Summing up the unique reach of each ad provides a standardized comparison of total exposure. | Deduplication Applied: Meta deduplicates users across ads within their platform, removing repeat counts of the same individual. |
Share of Ads Voice | Represents the total attention captured by summing the reach of all ads. Gives a comprehensive view of campaign reach. | Focus on Unique Reach: Meta’s deduplication aims for exact precision within the Meta ecosystem, reporting the total unique exposure. |
Comparison Strength | Cross-platform, comprehensive: Share of Ads Voice works across multiple platforms, giving a full-market view. | Platform-limited: Meta’s reach data is specific to its ecosystem, limiting comparisons outside of Facebook/Instagram. |
Data Limitation | Cross-Ad Comparison Possible: Ravineo does not deduplicate across multiple ads due to privacy and technical constraints. | Single-Ad Focus: Meta focuses on deduplicating reach within individual campaigns but doesn’t offer comprehensive cross-platform views. |
Read Next: