Competitive ads data revealed through a few easy to use charts and indicators.
Ravineo Ads Research is powerful but simple. There are just two views:
- Dashboard view (the default view): this is your aggregated, filterable market overview
- Ad Campaigns view: individual ads and their metrics
Your dashboard is the main view in Ravineo Ads Research. It’s the birds-eye view of your competition, with a few easy-to-understand metrics and indicators.
Let’s see how it works.
Navigating Dashboards
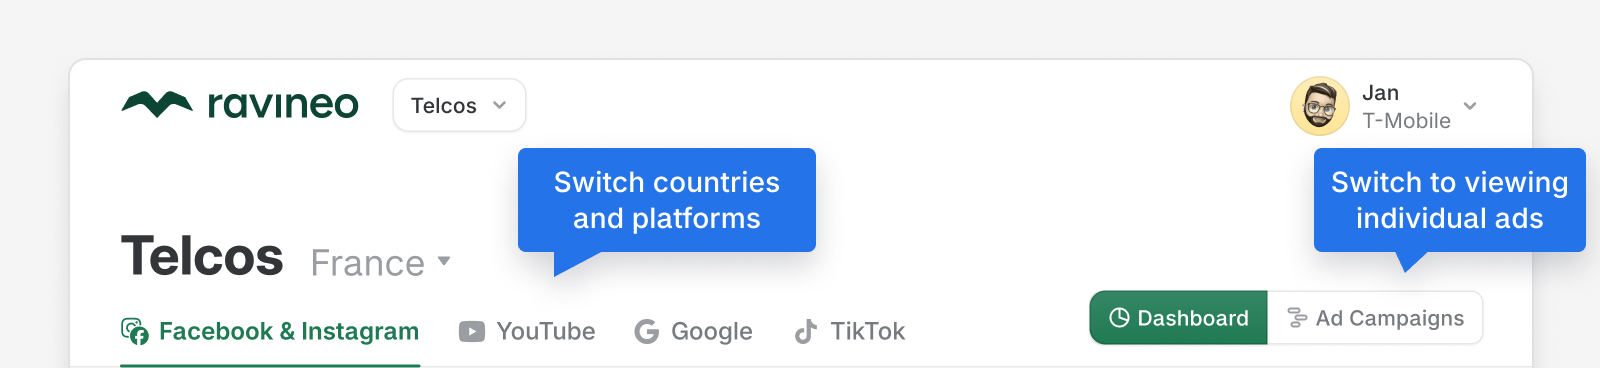
A dashboard will usually have a few countries set up, which can have different competitive brands for each country. Pick a country next to the dashboard name.
You can choose between available platforms with the tabs.
Finally, to view individual ads, switch to the Ad Campaigns view at the top right.
Filters
By default, we compare and display whole brands.
With Filters, you can drill down into your data, and only look at specific audiences, platforms, timeframes or ad categories (analyzed with AI).
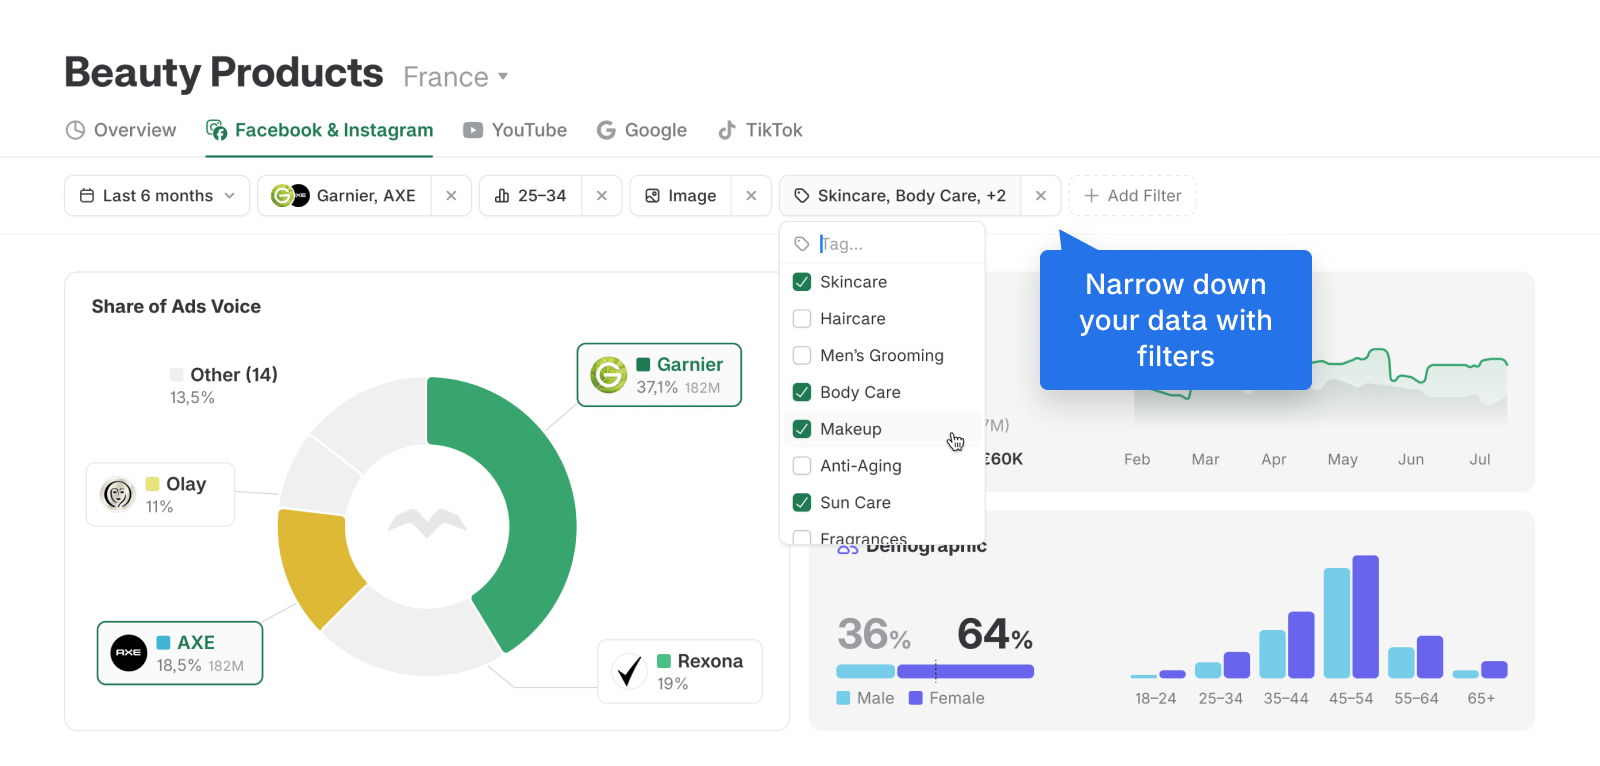
As you change filters, the dashboard adjusts to show you relevant data. This way, you can view things like:
- Single brand compared to all the rest
- Ads containing images in a certain product category
- Who had the most reach with younger women in the last 6 months
- and many more...
The specific filters available on each dashboard depend on the platform you’re viewing and on your exact setup.
Ravineo & Meta Metrics Comparison
Metric | Ravineo | Meta (Facebook & Instagram) |
|---|---|---|
Reach Calculation | Cumulative Unique Reach: Sum of the unique reach for each individual ad. Captures the total exposure across multiple ads. | Deduplicated Unique Reach: Tracks the actual number of distinct individuals reached across multiple ads, eliminating duplicates. |
Example (10 Ads) | If 10 ads each reach 1M people, Ravineo reports a total reach of 10M. | Meta would show a deduplicated reach of, for example, 1.4M unique people across the 10 ads. |
Deduplication | No Deduplication: Summing up the unique reach of each ad provides a standardized comparison of total exposure. | Deduplication Applied: Meta deduplicates users across ads within their platform, removing repeat counts of the same individual. |
Share of Ads Voice | Represents the total attention captured by summing the reach of all ads. Gives a comprehensive view of campaign reach. | Focus on Unique Reach: Meta’s deduplication aims for exact precision within the Meta ecosystem, reporting the total unique exposure. |
Comparison Strength | Cross-platform, comprehensive: Share of Ads Voice works across multiple platforms, giving a full-market view. | Platform-limited: Meta’s reach data is specific to its ecosystem, limiting comparisons outside of Facebook/Instagram. |
Data Limitation | Cross-Ad Comparison Possible: Ravineo does not deduplicate across multiple ads due to privacy and technical constraints. | Single-Ad Focus: Meta focuses on deduplicating reach within individual campaigns but doesn’t offer comprehensive cross-platform views. |
Read Next: