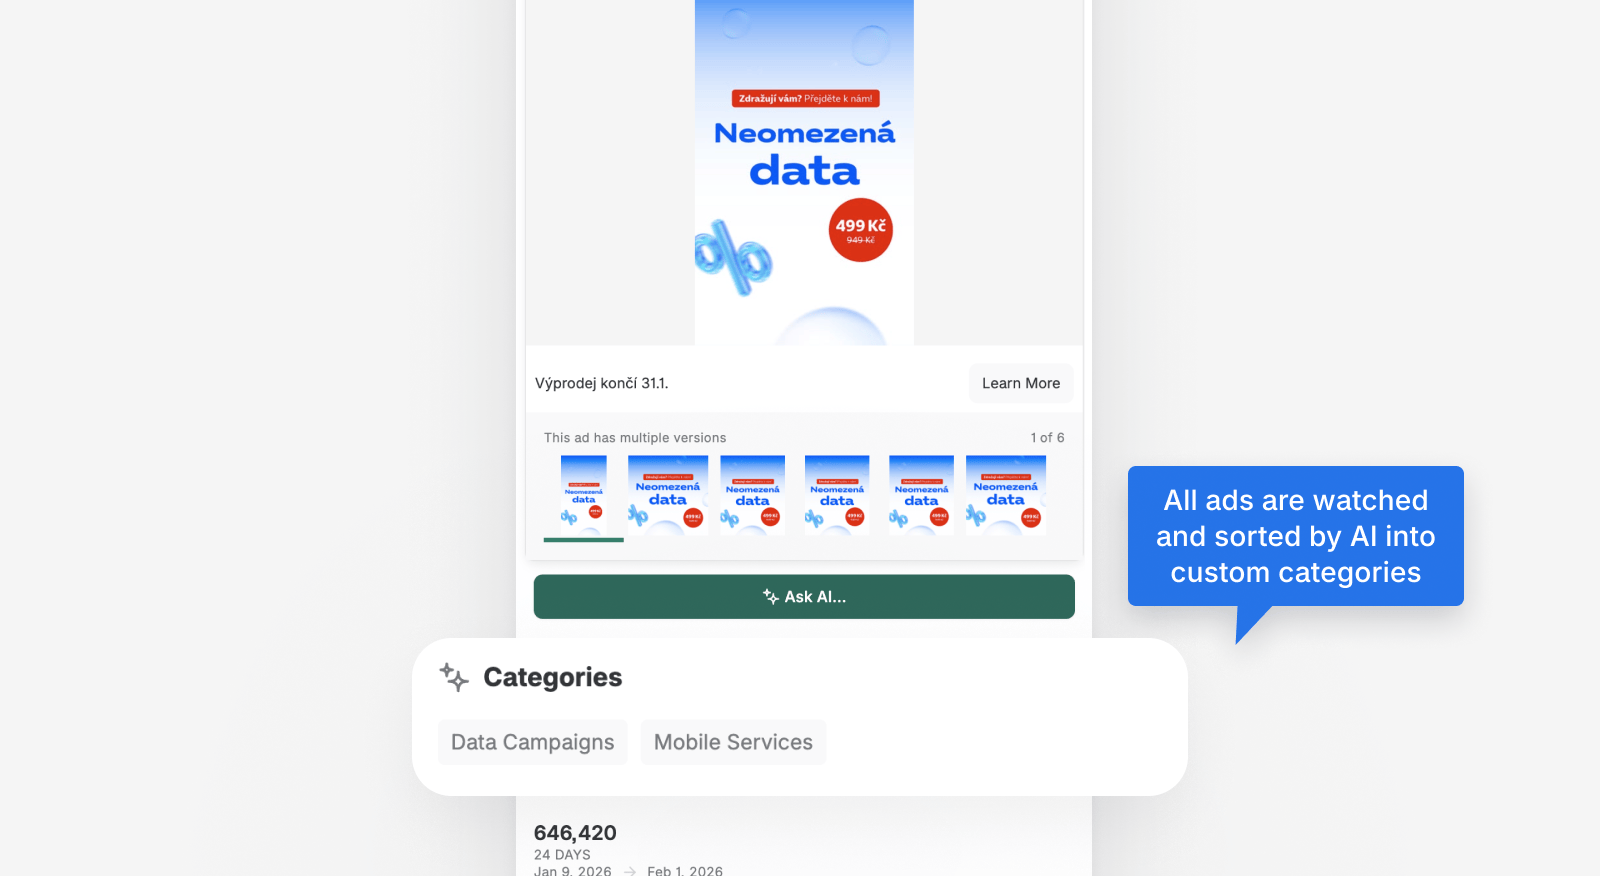
Automatically categorise every ad using AI, and validate or adjust classifications directly in the dashboard
Ravineo automatically categorises every ad on your dashboard using AI – both yours and your competitors'. This allows you to filter, compare, and export data by product category, campaign theme, or any custom framework that fits your business.
We support two ways of categorising ads, both fully automatic:
- AI Categorisation
- Keyword matching

AI Categorisation
Our AI engine analyses the creative content of every ad and assigns it to your custom-defined categories.
Categories are defined by you – you set the names, describe the intent, and specify what should and should not be included. Ravineo then trains the model to apply those definitions consistently across all ads, all brands, and all markets.
Category definitions are shared across all markets to preserve comparability. If you are tracking multiple countries, this means that a category like “Internet Services” or “Infant Nutrition” means exactly the same thing in every market. When a definition is refined, it improves everywhere at once – keeping cross-market comparisons valid.
For each ad, the AI provides a confidence level (High, Medium, or Low) and a detailed reasoning explanation. Accuracy is typically 95–98%. Edge cases – such as ads that promote multiple products or use indirect messaging – can be manually corrected at any time.
Ads Style
Every ad is also classified by Ads Style – our AI watches the creative and estimates whether it looks like a Brand Ad or an Influencer Ad (creator-style content). Unknown is used where the AI cannot make a confident call.
Unlike the Partnership Ads flag, which comes from the platform's official paid-partnership metadata, Ads Style is inferred from the creative itself. See the Ad Campaigns guide for the full comparison.
How Our Clients Use AI Categorization
Product-Level Competitive Intelligence
Track how competitors distribute ad spend across specific product categories, not just at the brand level. A hair care company can see whether rivals are investing more in shampoo or styling, while a financial services brand can break down competitor activity by ETFs, savings accounts, or trading products.
Cross-Market Category Benchmarking
Define your categories once and Ravineo applies them consistently across all your markets. Share of voice becomes directly comparable across regions, so performance gaps stand out without having to reconcile different local taxonomies.
Creative Strategy by Category
Understand what competitors are actually communicating within each category. With ads classified into your custom categories, you can spot shifts in messaging, positioning, and creative approach across thousands of ads at a glance.
Multi-Product Creative Detection
When a single ad features multiple products — say a holiday gift set covering skincare and fragrance — the AI flags each relevant category. That way share-of-voice numbers stay accurate and you don't lose visibility into how competitors bundle their messaging.
Setting Up Your Categories
To activate AI categorisation, you need to provide Ravineo with your category framework. For each category, include:
- Category name
- Description of intent – what this category is meant to capture
- Clear inclusion criteria – what types of ads should be classified here
- Clear exclusion criteria – what should not be classified here
The more precise your definitions, the more accurately the model can apply them. The number of categories available is specified in your confirmed quote.
Get in touch with us to activate AI categorisation on your dashboard.
Managing & Adjusting Categories
While the AI handles categorisation automatically, you have full control to review and correct individual ad classifications directly in the dashboard. This is especially useful for high-spend ads, strategically important campaigns, or creatives that combine multiple products or themes.
Manual adjustments are also valuable feedback: over time, they help refine the model so future classifications become progressively more accurate for your specific use case. Every correction you make is visible on our side and used to continuously improve categorisation quality.
Where to find it
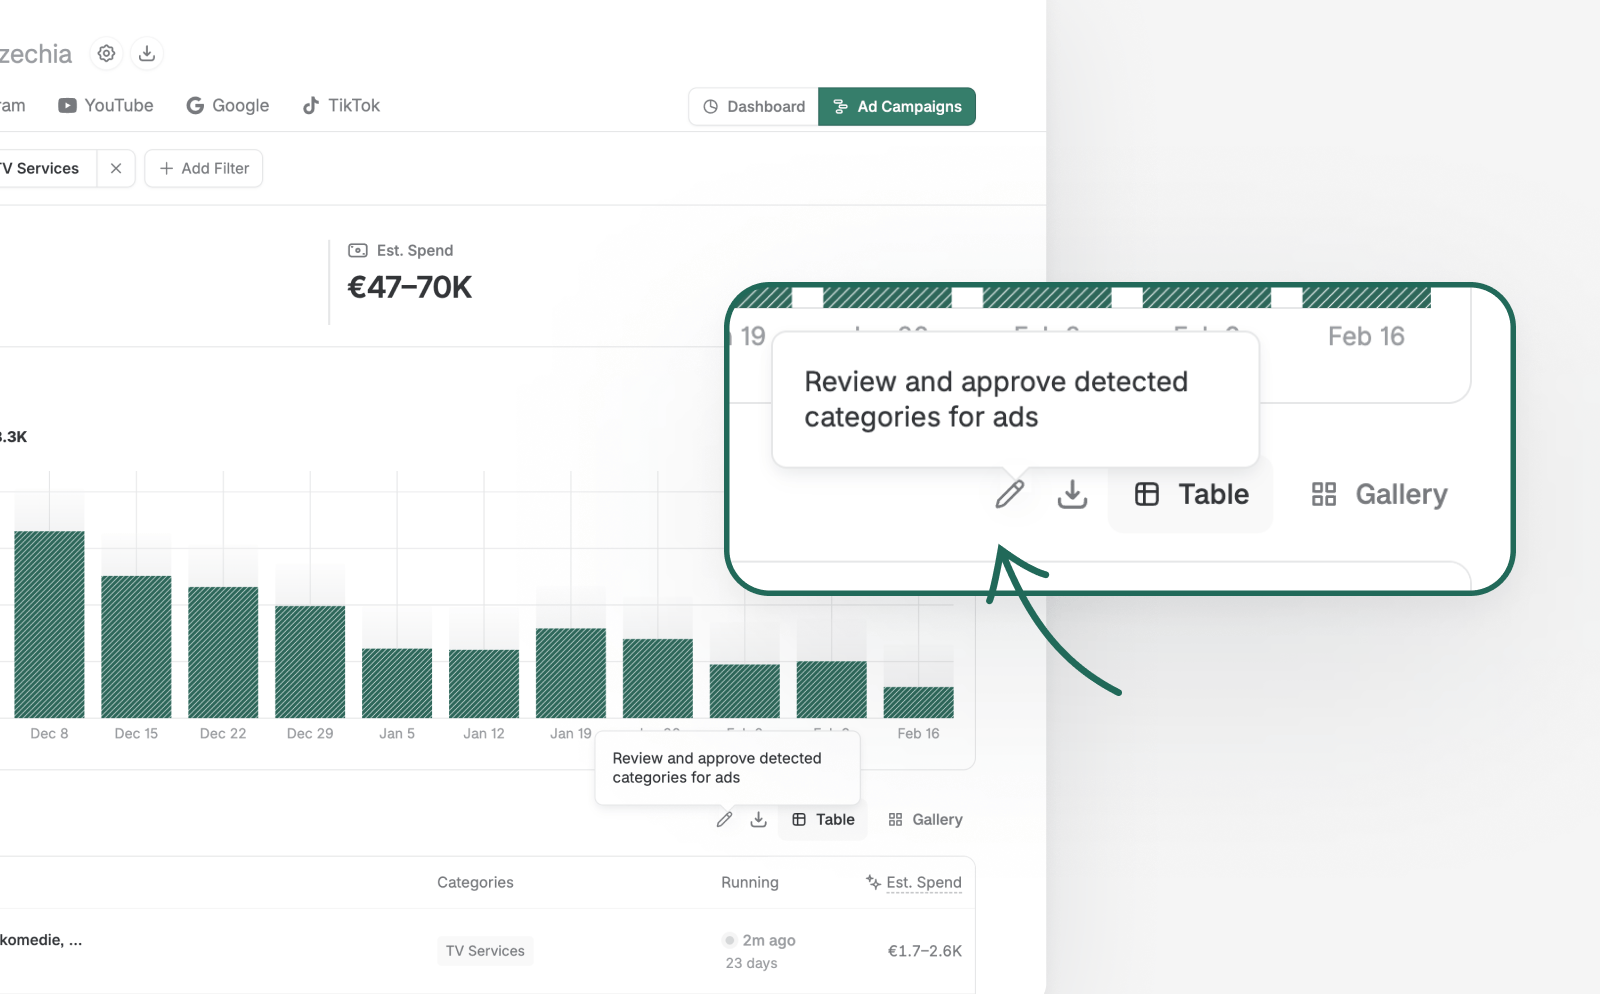
From the main dashboard, navigate to Ad Campaigns. In the ads table, you will find two entry points:
- A pencil icon next to each individual ad row – to edit that specific ad's categories
- A pencil icon in the table header – to open the bulk "Review and approve detected categories" mode
Reviewing a single ad
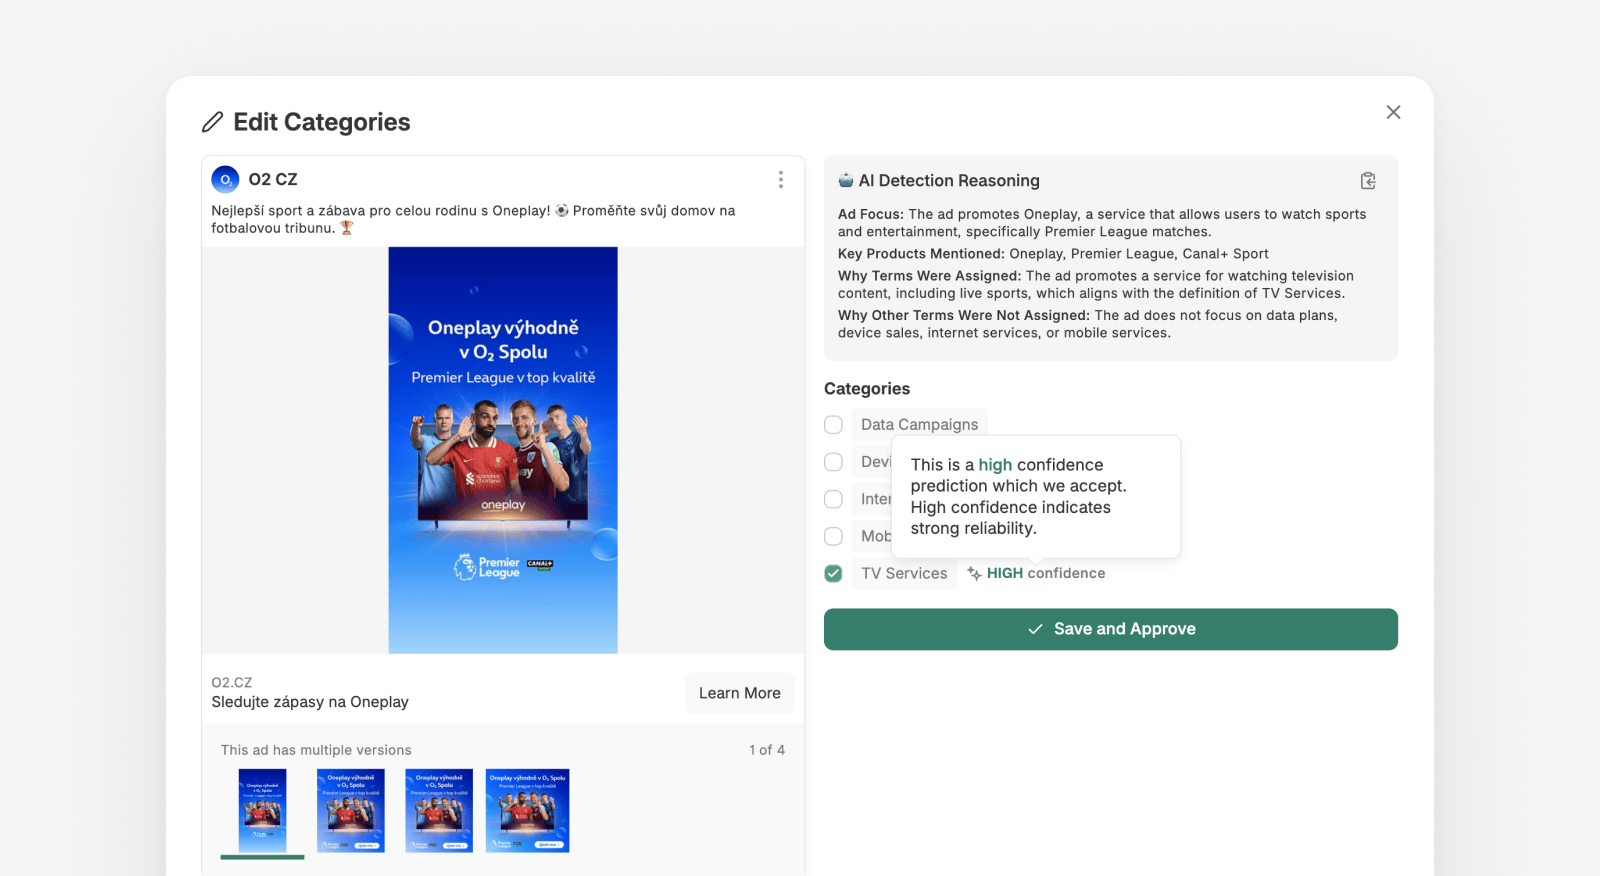
Click the pencil icon next to an ad to open the category editing view. The panel shows:
- The ad creative, with navigation arrows if the ad has multiple versions
- The AI Detection Reasoning panel – a transparent, step-by-step explanation of why each category was or was not assigned
- The full list of your categories with checkboxes, showing which ones the AI assigned
- HIGH / MEDIUM / LOW confidence indicators next to each assigned category
Confirm the AI's suggestions, uncheck any incorrect categories, or tick additional categories that should apply. Click Save and Approve to apply your changes. Updates are reflected instantly across all dashboards, charts, share of voice calculations, and reporting views.
Reviewing multiple ads at once
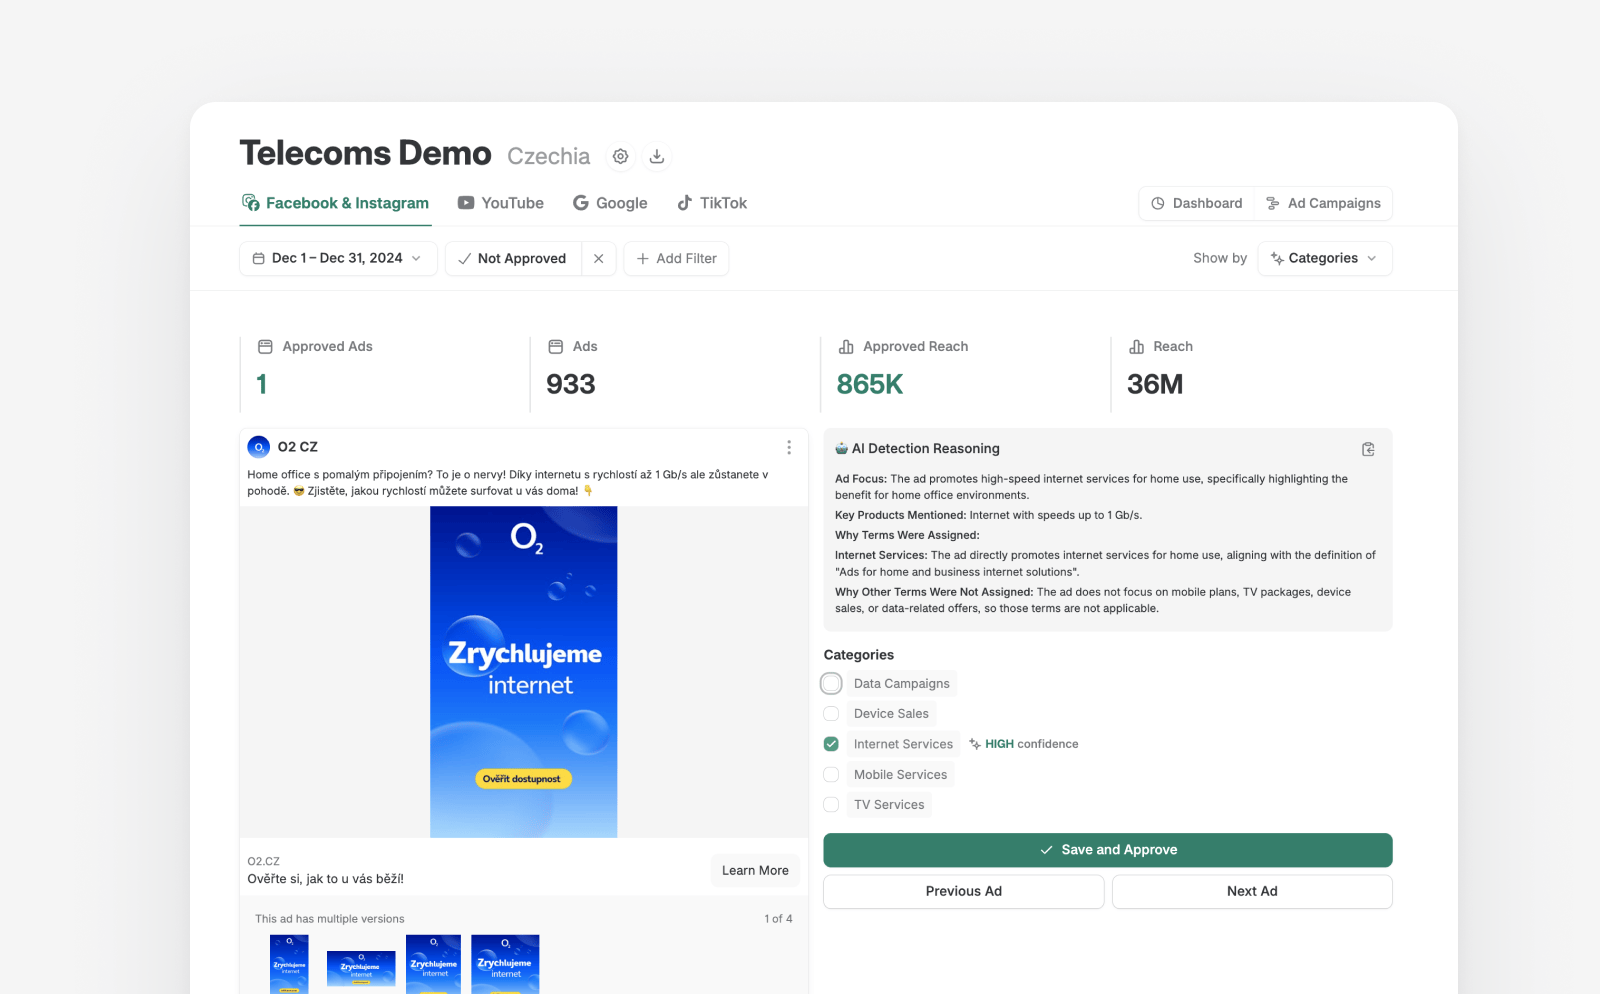
The bulk review mode lets you work through a larger set of ads in a streamlined flow. Navigate through ads one by one, approve correct classifications with a single click, and make adjustments where needed. This is particularly useful when onboarding a new market or brand, or after a new batch of ads has been detected.
Viewing by Categories (Dimensions)
By default, most Ravineo dashboards compare brands. This is reflected in the Share of Ads Voice pie chart, Cumulative Unique Reach over time, and the main comparison table.
You can change the primary dimension of your dashboard (“Show by”) to shift the focus of your data.
For example, you can switch to viewing categories within ads as the main focus. Clients often use this to compare product categories, track external retailers marketing their products, and more.

Keep in mind that your category system may not cover all ads on the dashboard, meaning some content won't match any category. In some cases, this “unknown” category may dominate, making it harder to compare actual categories.
To manage this, use the “Hide unknown” switch to show or hide the unknown portion in the charts.

Keyword Matching
In simpler cases, you can categorise content or advertisers by using keywords found in the ad or advertiser information. For example, if you're a manufacturer of personal electronics, you can use this method to categorise ads by e-shops that sell your products and run ads for them.
By setting these e-shops as the primary dimension (using the “Show by” switch), you can focus on their advertising activity. Combine this with a filter for AI-detected product categories (like tablets), and you'll be able to see which e-shops are advertising your tablets the most and how accurately they are doing so.
Ravineo & Meta Metrics Comparison
Metric | Ravineo | Meta (Facebook & Instagram) |
|---|---|---|
Reach Calculation | Cumulative Unique Reach: Sum of the unique reach for each individual ad. Captures the total exposure across multiple ads. | Deduplicated Unique Reach: Tracks the actual number of distinct individuals reached across multiple ads, eliminating duplicates. |
Example (10 Ads) | If 10 ads each reach 1M people, Ravineo reports a total reach of 10M. | Meta would show a deduplicated reach of, for example, 1.4M unique people across the 10 ads. |
Deduplication | No Deduplication: Summing up the unique reach of each ad provides a standardized comparison of total exposure. | Deduplication Applied: Meta deduplicates users across ads within their platform, removing repeat counts of the same individual. |
Share of Ads Voice | Represents the total attention captured by summing the reach of all ads. Gives a comprehensive view of campaign reach. | Focus on Unique Reach: Meta’s deduplication aims for exact precision within the Meta ecosystem, reporting the total unique exposure. |
Comparison Strength | Cross-platform, comprehensive: Share of Ads Voice works across multiple platforms, giving a full-market view. | Platform-limited: Meta’s reach data is specific to its ecosystem, limiting comparisons outside of Facebook/Instagram. |
Data Limitation | Cross-Ad Comparison Possible: Ravineo does not deduplicate across multiple ads due to privacy and technical constraints. | Single-Ad Focus: Meta focuses on deduplicating reach within individual campaigns but doesn’t offer comprehensive cross-platform views. |
Read Next: